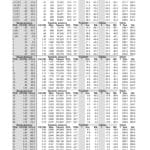
Dealing with R410A in HVAC systems requires a solid understanding of the relationship between pressure and temperature. This guide breaks down the R410A pressure-temperature (PT) chart, a crucial tool for maintaining and troubleshooting these systems. We’ll cover how to interpret the chart, the implications of different readings, and essential safety considerations.
Decoding the R410A PT Chart
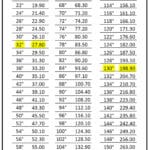
The R410A PT chart is a visual representation of the refrigerant’s pressure at various temperatures when it’s in a saturated state (a mixture of liquid and vapor). It’s essential for:
- Determining correct pressure: Ensuring system operation within safe and efficient parameters.
- Troubleshooting: Diagnosing potential issues based on pressure deviations.
- Charging: Adding the correct amount of refrigerant.
Why the PT Chart Matters
R410A replaced the older R-22 due to its lower ozone depletion potential. However, it’s more sensitive to pressure and temperature fluctuations. The PT chart acts as a guide, translating pressure readings into actionable insights about system health.
How to Use the PT Chart
- Measure Ambient Temperature: Record the temperature surrounding the outdoor unit (condensing unit).
- Locate Temperature on Chart: Find this temperature on the chart’s horizontal axis.
- Find Corresponding Pressure: Trace a vertical line from the temperature to the pressure curve. The intersection point indicates the expected pressure.
- Measure System Pressures: Use gauges to measure the system’s high-side (discharge) and low-side (suction) pressures.
- Compare and Analyze: Compare your measured pressures with the chart value. Significant deviations may indicate problems.
Interpreting Pressure Readings: What’s Normal?
While small pressure variations are normal, larger discrepancies can signal issues. For instance:
- Low Low-Side Pressure: This might suggest a refrigerant leak, restricted airflow, or a malfunctioning metering device.
- High High-Side Pressure: This could indicate problems with the condenser, a failing compressor, or an obstructed air filter.
Typical Operating Pressures (Guidelines Only)
In typical field conditions, you might see:
- Low Side: 115-120 PSI
- High Side: 410-420 PSI
However, these are just estimates. Always rely on the PT chart and the specific system’s requirements for accurate values. Remember, these pressures are dynamic and change with system operation and load.
Key R410A Properties
| Property | Value(s) | Unit(s) | Importance |
|---|---|---|---|
| Low-Side Pressure | ~120 psi (at 75°F ambient – approximate) | psig | Suction pressure; deviations suggest airflow or refrigerant charge problems. |
| High-Side Pressure | < 600 psi (at 95°F ambient – approximate) | psig | Discharge pressure; deviations suggest condenser or compressor issues. |
| Critical Temperature | 72.8°C / 163.04°F | °C / °F | Above this, refrigerant cannot liquefy regardless of pressure. |
| Critical Pressure | 4.86 MPa / 704.88 lbf/in² / 711 psi / 49 bar | MPa / lbf/in² / psi / bar | Minimum pressure for liquefaction at the critical temperature. |
| Auto-ignition Temp | 750°C / 1382°F | °C / °F | Temperature at which refrigerant could spontaneously ignite (safety critical). |
Superheat and Subcooling: Advanced Diagnostics
Superheat and subcooling offer finer diagnostic insights:
- Superheat: How much hotter the refrigerant vapor is than its boiling point at a given pressure.
- Subcooling: How much cooler the liquid refrigerant is than its condensing point.
These metrics, derived from the PT chart and pressure readings, are essential for optimizing system performance and identifying potential problems.
Safety First! Handling R410A
R410A, like all refrigerants, requires careful handling. Follow safety protocols, wear appropriate PPE, and ensure proper ventilation. Mishandling can lead to environmental damage and personal injury. EPA certification is crucial for responsible handling.
The Evolving Landscape: R410A and Beyond
Due to its high Global Warming Potential (GWP), R410A may be phased out in the future. New, lower-GWP refrigerants are continuously being developed. Staying updated on these changes and understanding the properties of new refrigerants is essential for HVAC technicians. For detailed information on another refrigerant, explore our comprehensive R22 PT chart.
What Should the High and Low Side Pressures Be for 410A?
As we’ve established, R-410A pressures are temperature-dependent. While ballpark figures like 115-120 PSI (low) and 410-420 PSI (high) exist, they are not substitutes for consulting a PT chart, which accounts for the specific ambient temperature.
Accurate charging is vital. Overcharging stresses the system, while undercharging hinders performance. Consult the PT chart and your system’s specifications. Experts typically charge R-410A in liquid form.
The future of R-410A is uncertain due to its high GWP. The industry is exploring lower-GWP alternatives. Staying informed about these emerging refrigerants is crucial.
Troubleshooting relies heavily on pressure readings. Deviations, like low suction pressure (possible leak) or high head pressure (potential condenser issue), offer diagnostic clues. Some experts believe hands-on experience, coupled with fundamental knowledge, is paramount for mastering R-410A. While current research supports established practices, new discoveries are always possible.
What Should the Pressure Be at 75 Degrees for 410A?
At 75°F, the static pressure of R-410A is likely around 217 PSIG. However, operating pressures (high and low side) differ significantly. They are dynamic and reflect the system’s activity.
The PT chart is essential for accurate diagnostics, including superheat, subcooling, and charge calculations. Don’t confuse static pressure with operating pressures!
R-410A’s high GWP suggests a potential phase-out due to regulations. Be aware of future refrigerant changes.
What Temperature Should 410A Run At?
R-410A doesn’t have a fixed operating temperature. Instead, it operates within a range of temperatures and pressures dictated by the system’s activity and ambient conditions. The PT chart is your guide.
The PT Chart: Your System’s Decoder
The PT chart reveals the saturation pressure for any given temperature. Use it to determine the expected pressure for a specific temperature and vice-versa.
Two Temperatures to Consider
Both the ambient temperature and the internal temperatures (evaporator and condenser) influence R-410A’s behavior.
“Normal” Pressures as Guidelines
Typical operating pressures serve as starting points but always refer to the PT chart and system specs.
Superheat and Subcooling: Fine-Tuning
These metrics are vital for optimizing performance and identifying potential problems early on.
Troubleshooting with the PT Chart
The PT chart is a powerful tool for diagnosing common system issues.
Safety First: Handling R-410A with Care
Always adhere to safety protocols and handle refrigerants responsibly. PPE, proper ventilation, and respecting safety precautions are paramount.
