Understanding your AC unit’s pressure readings is key to ensuring its efficient and safe operation. This comprehensive guide decodes the complexities of R410a pressure charts, empowering you to diagnose potential issues and maintain optimal cooling performance.
Decoding R410a: Your AC’s Vital Fluid
R410a is a common refrigerant in modern air conditioning systems, known for its environmental friendliness compared to older refrigerants like R22. It operates at higher pressures, leading to more efficient cooling. However, these higher pressures require careful monitoring and understanding. It’s important to note that R410a is being phased out due to its high Global Warming Potential (GWP). Newer, more eco-friendly refrigerants are emerging, so consider future-proofing your system when the time comes for replacement.
The Pressure Chart: Your AC’s Roadmap
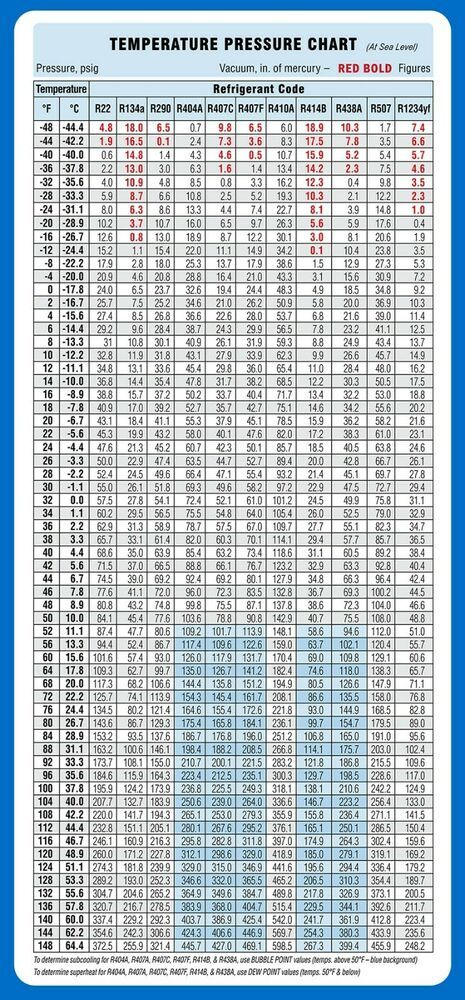
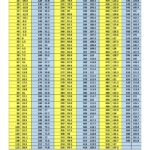
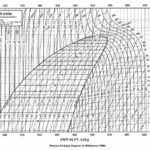
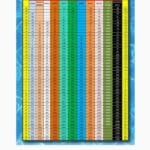
An R410a PT Chart 410A is essential for understanding the relationship between pressure and temperature within your AC system. It acts as a roadmap, guiding you towards accurate diagnostics. Just as a car’s temperature gauge alerts you to overheating, pressure readings in your AC system indicate its operational status.
High vs. Low Pressure: A Balancing Act
Your AC system functions with two distinct pressure zones: the high-pressure side (discharge) and the low-pressure side (suction). The high side, after the compressor, handles hot, compressed refrigerant. The low side carries the cooled refrigerant back to the compressor. This pressure difference drives the cooling process. Significant imbalances between these pressures can suggest problems like refrigerant leaks, airflow restrictions, or compressor malfunctions.
Interpreting the Chart: Finding Your Way
An R410a pressure chart correlates temperature readings with corresponding high and low side pressures. To use it, find the outdoor ambient temperature and locate the corresponding pressure ranges. Remember, these values are estimates. Consulting a detailed chart specific to your system ensures the most accurate data.
| Outdoor Temperature (°F) | Low Side Pressure (psi) | High Side Pressure (psi) |
|---|---|---|
| 70 | ~110 | ~270 |
| 80 | ~130 | ~310 |
| 90 | ~150 | ~350 |
| 100 | ~175 | ~400 |
Note: These are simplified examples. Consult a comprehensive R410a PT chart for precise figures.
Factors Influencing Pressure: More Than Meets the Eye
While ambient temperature is the primary factor, other variables influence pressure readings. System load (how hard your AC is working), airflow restrictions (like a dirty air filter), and the refrigerant charge all play a role.
Troubleshooting with Pressure: Spotting the Clues
Pressure readings outside the normal range often signify an issue. Low pressure might suggest a leak, while high pressure could indicate overcharging or restricted airflow. Fluctuating pressures may point to a faulty expansion valve or other control problems. Some experts believe that pairing pressure readings with superheat and subcooling calculations provides a more thorough diagnosis.
95°F and Beyond: Handling the Heat
On a 95°F day, expect high side pressures around 295-296 psi. This is a general benchmark, and some variation is normal. Using an accurate thermometer and referencing your PT Chart 410A is the best method to determine the proper figures.
Safety First: Handling Refrigerant Responsibly
Refrigerant under pressure requires careful handling. Wear safety glasses and gloves, and ensure adequate ventilation. For significant repairs or if you suspect a leak, contact a licensed HVAC professional.
Superheat and Subcooling: Fine-Tuning Your System
Superheat and subcooling, calculated from temperature and pressure differences, offer a granular view of your system’s refrigerant charge. They are valuable metrics for optimizing performance.
The Future of AC Diagnostics: Interactive Tools
Emerging technologies like interactive R410a pressure charts and automated troubleshooting flowcharts promise more precise and user-friendly diagnostics.
What Should R410a Pressures Be?
R410a pressures are dynamic, influenced by ambient temperature and other factors. While typical high/low side pressures are approximately 410-420 psi and 115-120 psi, respectively, always consult a PT Chart 410A for accurate readings based on your specific conditions. Remember, incorrect pressures can indicate system problems and impact efficiency.
What Should My R410a Gauges Read?
Gauge readings provide valuable insights into your system’s health. Fluctuations are normal, and relying on a single “ideal” pressure is misleading. Understanding the dynamic interplay of temperature, pressure, superheat, and subcooling, along with utilizing a PT Chart 410A, is critical for proper system assessment and maintenance.
Understanding R410a Suction Pressure
R410a suction pressure, or low-side pressure, is crucial for efficient operation. While a general range is 115-120 psi, a PT Chart 410A specific to the operating temperature provides the most accurate assessment. Incorrect suction pressure may indicate refrigerant leaks or faulty components.
For stargazers, the Orion SkyQuest XT8 offers an incredible view of the cosmos.
- Discover Long Black Pepper: Flavor & Health Benefits - April 25, 2025
- Shocking Twists: The Grownup Review: Unreliable Narration - April 25, 2025
- A Quiet Place Book vs Movie: A Deep Dive - April 25, 2025
