This guide dives into the crucial relationship between pressure and temperature in R22 refrigerant systems, offering practical advice and troubleshooting tips. Even though R22 is being phased out, understanding its properties remains essential for maintaining existing systems. Whether you’re an HVAC professional or a homeowner, this guide will equip you with the knowledge to keep your R22 system running smoothly.
Decoding R22 Pressure-Temperature Relationships
What is an R22 Pressure Temperature (P/T) Chart?
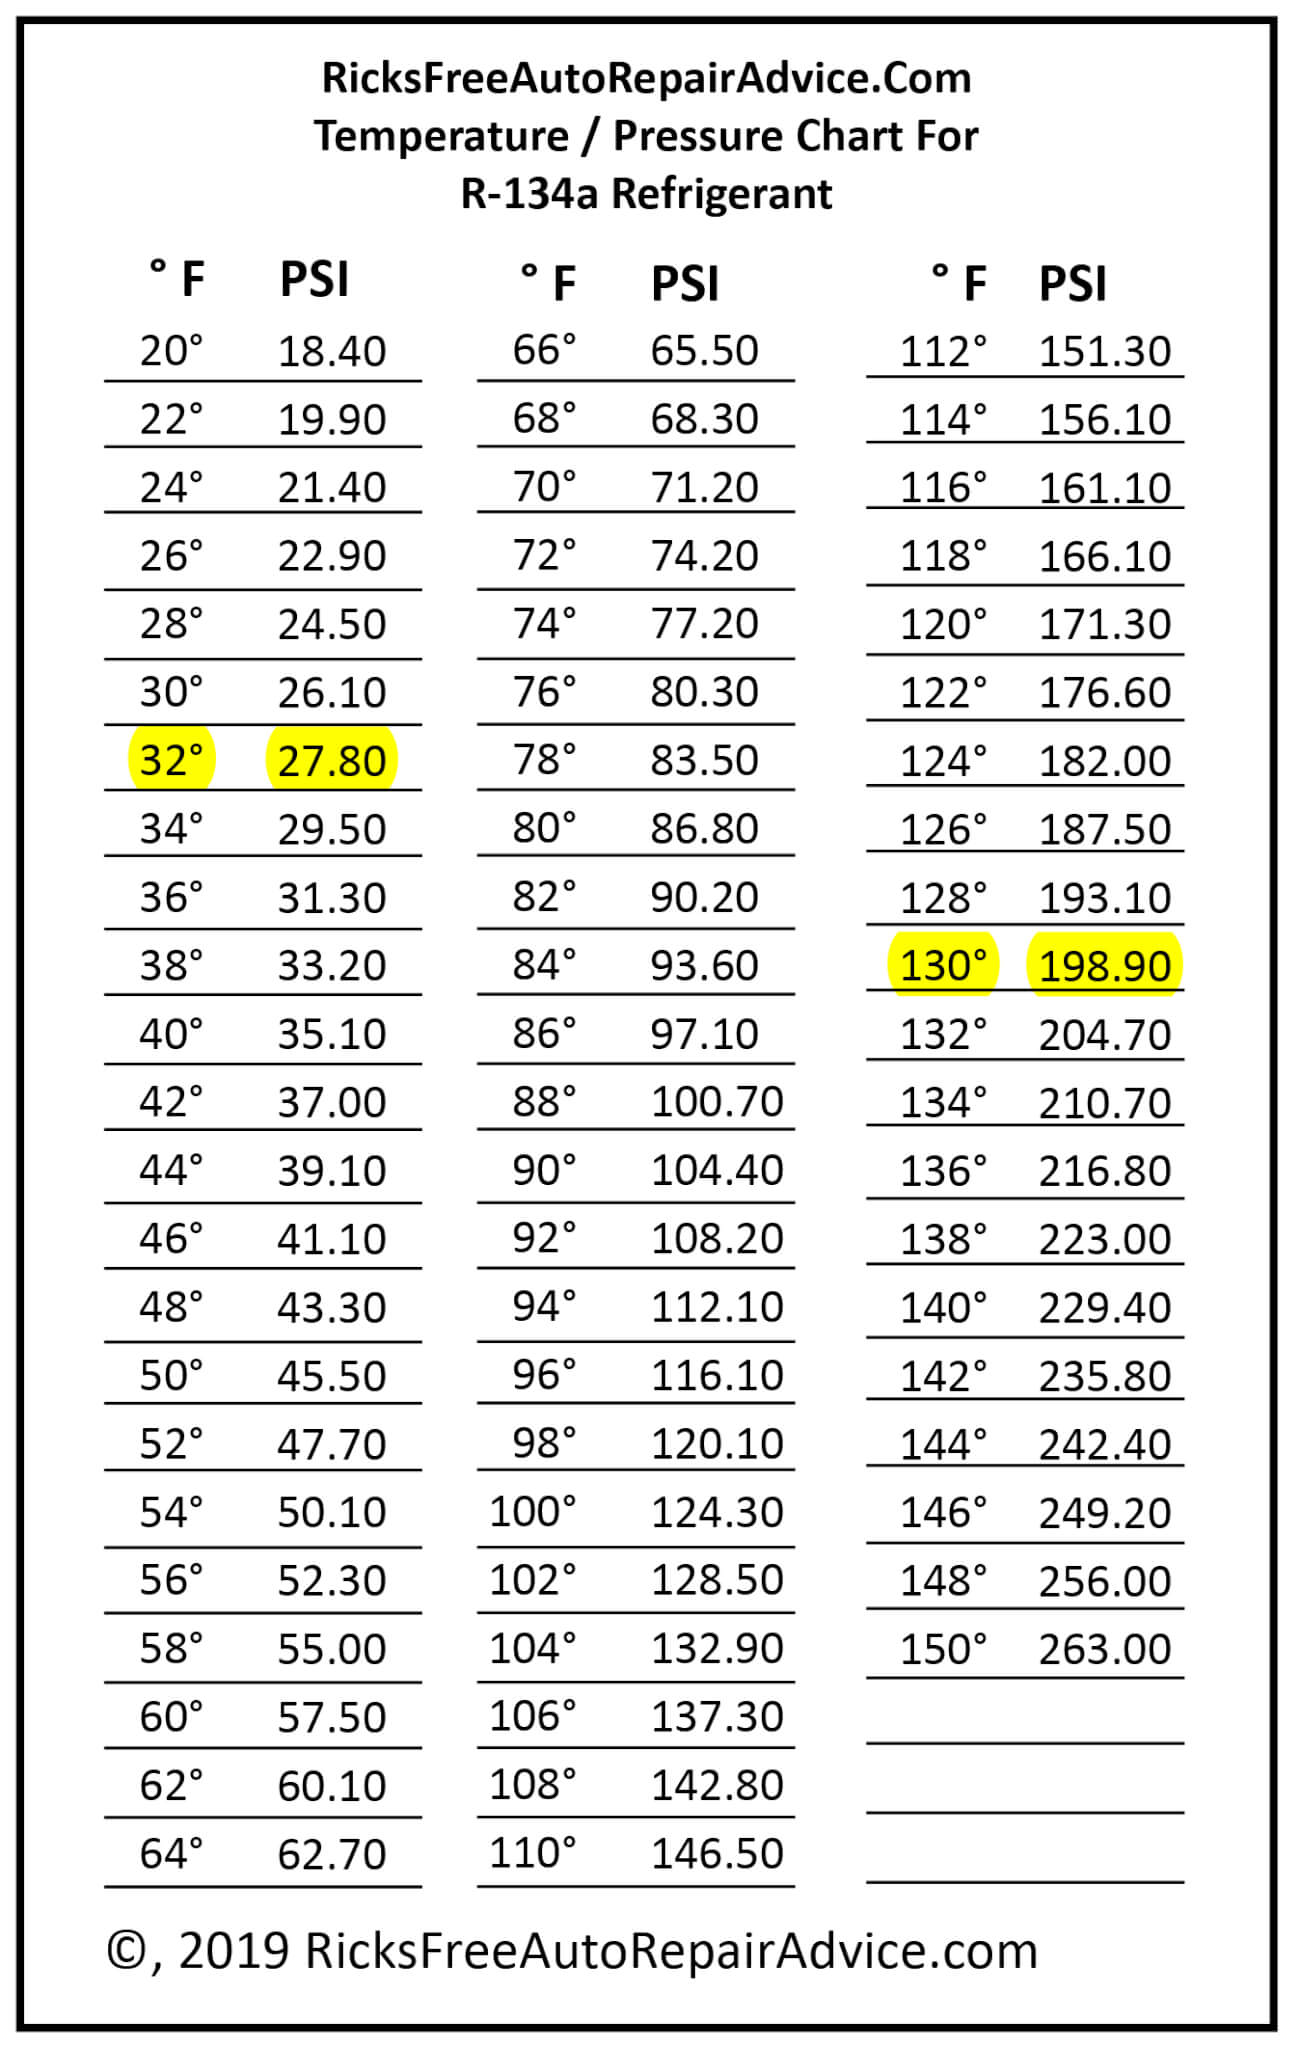
An R22 P/T chart is a vital tool that decodes the relationship between the pressure and temperature of R22 refrigerant. It’s essentially a roadmap for understanding how these two factors interact within your AC system. By comparing your system’s actual readings with the chart’s values, you can effectively diagnose potential issues and ensure efficient operation. Think of it as a translator, converting the complex language of your AC into something readily understandable.
How to Use an R22 P/T Chart
Using a P/T chart is surprisingly straightforward. First, measure your system’s temperature. Then, locate that temperature on the chart and find the corresponding pressure value. Simple, right? But the real power of the chart comes into play when the readings don’t match up. Discrepancies between expected and actual values can point towards a variety of problems, giving you a head start in troubleshooting.
Factors Influencing R22 Pressure
While temperature is a primary driver, other factors can also influence R22 pressure:
- Ambient Temperature: The temperature surrounding the unit plays a significant role. Higher ambient temperatures generally lead to higher system pressures.
- Superheat: This refers to the added heat after the refrigerant vaporizes. Think of it as the “extra push” of heat.
- Subcooling: This is the cooling applied after the refrigerant condenses back into a liquid. It’s like giving the refrigerant a “cool down” period.
These elements, in conjunction with the system’s overall health, contribute to the pressure readings you observe.
Troubleshooting with an R22 P/T Chart
An R22 P/T chart is your primary diagnostic tool. Here’s how it helps identify problems:
- Low Pressure: This could suggest a refrigerant leak, a restriction somewhere within the system, a failing compressor, or perhaps something else. It’s not always a straightforward answer.
- High Pressure: This might indicate an overcharge of refrigerant, a blocked condenser coil (check that air filter!), or another malfunctioning component.
The PT chart helps narrow down the potential culprits, making repairs more efficient and targeted.
R22: Understanding the Phaseout
R22 is being phased out due to environmental concerns, specifically its contribution to ozone depletion. Newer systems utilize refrigerants like R-410A, which are more ozone-friendly. If your system still relies on R22, it’s wise to be aware of long-term options, such as retrofitting or replacement. Consulting with a qualified HVAC technician can help you navigate this transition.
Safety First: Handling R22
Working with R22 necessitates caution. Though not inherently toxic, it can cause frostbite and displace oxygen in confined spaces. Always prioritize safety, wear appropriate protective gear, and leave refrigerant handling to trained professionals. It’s simply not worth the risk.
Additional Resources and Information
For those wanting to delve deeper, here are helpful resources:
- Downloadable R22 PT Charts: Numerous online resources offer downloadable charts in various formats, including PDFs and Excel spreadsheets.
- Videos: YouTube channels dedicated to HVAC often feature practical demonstrations of P/T chart usage in real-world scenarios.
- TB500 dosage: (This link seems out of context and likely shouldn’t be included here. Please verify its relevance.)
- tracer rounds 22lr: (This link also seems out of context. Please verify its relevance.)
R-22 Pressure Guide: Understanding Ideal & Safe Operating Ranges
Understanding Normal R-22 Pressures
The pressure in your R-22 system is a key indicator of its health. “Normal” pressures for R-22 typically range from 76 psig (pounds per square inch gauge) on the low-pressure (evaporator) side at 45°F to around 260 psig on the high-pressure (condenser) side at 120°F. These values can vary slightly depending on the specific equipment and ambient conditions. However, significant deviations from these ranges often suggest a problem.
R-22 Phaseout and Continued Importance
While R-22 is no longer used in new air conditioners, many older systems still rely on it. Understanding R-22 pressures, the role of a Pressure-Temperature (PT) chart, and basic troubleshooting remains crucial for maintaining these systems.
Pressure-Temperature (PT) Charts: Your Diagnostic Tool
A PT chart maps the direct relationship between R-22 pressure and temperature. Using the ambient temperature and a PT chart, you can determine the expected pressure. Discrepancies between the expected and actual pressure can indicate various issues, such as leaks, blockages, or component failures.
Troubleshooting Based on Pressure Readings
Abnormal pressure readings offer valuable clues for troubleshooting:
- Low Pressure: Often suggests a refrigerant leak, a restriction within the system, or a failing compressor.
- High Pressure: May indicate an overcharge of refrigerant, a blocked condenser coil, or other component malfunctions.
Superheat and Subcooling for Advanced Diagnostics
For a deeper understanding, explore the concepts of superheat (heat added to vaporized refrigerant) and subcooling (heat removed from liquid refrigerant). These metrics help fine-tune refrigerant charge and optimize system efficiency.
Importance of Professional Assistance
While this guide provides basic information, working with refrigerants involves safety risks. Always consult a qualified HVAC technician for system diagnostics and repairs.
R-22 Heat Mode Pressures: A Comprehensive Guide
Typical R-22 Pressures in Heat Mode
In heat mode, R-22 systems typically exhibit different pressures compared to cooling mode. You’ll likely see an evaporator pressure of around 0.4 MPa (-7°C) and a condenser pressure of approximately 1.6 MPa (40°C). These pressures, and their associated temperatures, are crucial for efficient heating performance.
The Importance of the Pressure-Temperature (PT) Chart
A PT chart is essential for verifying proper R-22 pressures in heat mode. By comparing actual readings with the chart’s values, you can quickly identify deviations that may indicate refrigerant leaks, an incorrect charge, or component malfunctions.
Troubleshooting with Pressure Readings
- Low Evaporator Pressure: Often suggests a refrigerant leak.
- High Condenser Pressure: Might indicate an overcharge of refrigerant or a blockage in the condenser coil.
Understanding the R-22 Phaseout
While R-22 is being phased out, many systems still utilize it. Knowing how to analyze pressures in heat mode is essential for maintaining these systems until they can be retrofitted or replaced with alternatives like R-410A.
Safety and Professional Expertise
Always prioritize safety when working with refrigerants. Consult a qualified HVAC technician for any diagnostics or repairs involving R-22.
Understanding R-22 Temperature & Pressure Relationships: A Comprehensive Guide
The Interplay of Temperature and Pressure in R-22
The relationship between temperature and pressure is fundamental to how R-22 operates in HVAC systems. As temperature increases, so does pressure, and vice versa. This principle is crucial for diagnosing and maintaining these systems.
Normal R-22 Operating Pressures and Troubleshooting
Typical operating pressures range from 76 psig at 45°F to 260 psig at 120°F. Deviations from these ranges can signal problems like leaks or component failure.
The R-22 PT Chart: A Crucial Tool
The PT chart visually represents the relationship between R-22 temperature and pressure. It’s a must-have tool for interpreting system readings and diagnosing problems.
R-22 Phaseout and Its Implications
Due to environmental concerns, R-22 is being phased out. However, understanding its properties remains essential for servicing existing systems.
Beyond Pressure and Temperature: Additional Properties of R-22
Beyond the PT chart, R-22’s liquid density (1.49 g/cm³ at -69°C) and gas density (3.66 kg/m³ at 15°C) offer further insights into its behavior.
Safety First: Handling R-22
Always prioritize safety when working with R-22. Consult a qualified HVAC technician for any diagnostics or repairs.
This expanded and reorganized guide provides a more comprehensive and practical understanding of R22 pressure and temperature relationships. Remember to always consult with a qualified HVAC technician for any system work involving refrigerants.
- Unlocking Francis Alexander Shields’ Finance Empire: A Comprehensive Biography - July 12, 2025
- Unveiling Francis Alexander Shields: A Business Legacy - July 12, 2025
- Francis Alexander Shields’ Business Career: A Comprehensive Overview - July 12, 2025


