Dealing with AC and refrigerators means understanding refrigerants. This guide on R410A focuses on its Pressure-Temperature (PT) chart—your essential tool for system analysis and troubleshooting. We’ll decipher the chart, calculate superheat and subcooling, and apply this knowledge to real-world scenarios. Let’s turn this chart into a powerful tool for keeping things cool.
Decoding the R410A PT Chart
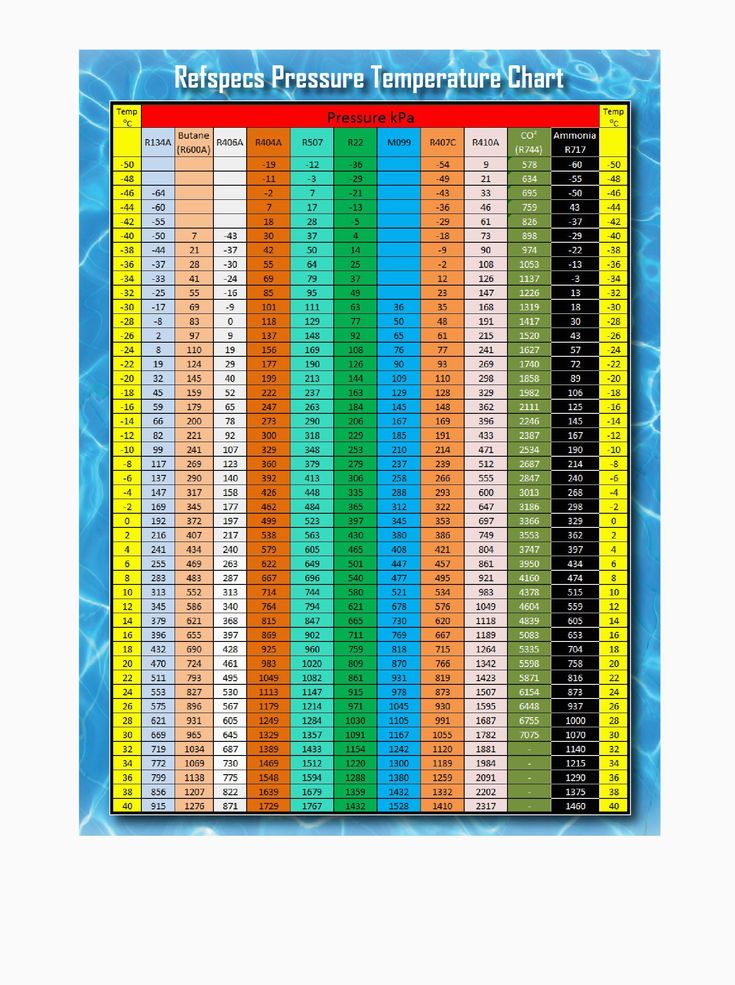
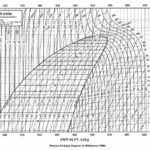
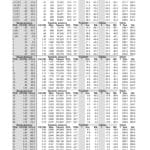
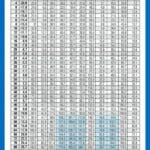
The R410A PT chart is a visual representation of the relationship between pressure and temperature for R410A refrigerant, especially in its saturated state (a mixture of liquid and vapor). A change in one always affects the other, and the PT chart helps us predict and interpret these changes, crucial for understanding how R410A, a common hydrofluorocarbon (HFC) blend, behaves in your HVAC system. It’s like a translator, converting between pressure and temperature readings.
Reading the Chart
Using the chart is straightforward:
- Find the Temperature: Locate the outdoor temperature on the horizontal axis (usually °F).
- Trace to Pressure: Draw a line upwards from your temperature point to the relevant pressure curve (vapor or liquid).
- Read the Pressure: Draw a horizontal line from the intersection point to the vertical axis (psig) to find the corresponding pressure. Reverse these steps to convert from pressure to temperature.
Why the PT Chart Matters
- Leak Detection: Low pressure often suggests a leak, prompting further investigation.
- Precise Charging: The chart, along with outdoor temperature, helps determine the correct refrigerant charge, preventing overcharging or undercharging.
- Performance Evaluation: Deviations from expected pressure-temperature relationships can reveal performance issues.
R410A System Pressures: A Temperature-Based Approach
Understanding R410A system pressures requires understanding their relationship with temperature. There’s no single “correct” pressure; it depends on the temperature and other factors. The PT chart is your key to navigating this relationship, especially for the low-side (suction line) and high-side (liquid line) pressures.
Low-Side Pressure
Typically between 120 and 150 psi, the low-side pressure represents the system “inhaling” refrigerant. This range can fluctuate based on system activity and ambient temperature.
High-Side Pressure
Closely tied to temperature, the high-side pressure rises with increasing temperature, much like a seesaw. On a hot day (e.g., 95°F), it might reach 295-296 psi. Consulting the R410A pressure chart high and low side is crucial.
Subcooling
Aim for around 11°F of subcooling (give or take 1.5°F). Subcooling, the difference between the liquid refrigerant’s temperature and its saturation temperature at that pressure, indicates the system’s refrigerant charge.
Influencing Factors
System pressures are influenced by:
- Ambient Temperature: Higher temperatures lead to higher pressures.
- System Load: Increased cooling demand raises pressures.
- System Condition: Leaks, blockages, or faulty components cause abnormal readings.
Ongoing research continues to explore the nuances of refrigerant performance. The mentioned ranges serve as general guidelines, and further studies may refine these understandings. Consider the dynamic relationship between pressure and temperature, using your PT chart as your guide.
Mastering the R-410A PT Chart: From Basics to Advanced Diagnostics
Beyond basic pressure readings, understanding how to use the R-410A PT chart unlocks valuable insights into system performance. Remember, the low-side pressure usually sits between 120-150 psi, while the high-side pressure fluctuates with temperature. Maintaining approximately 11°F of subcooling (plus or minus 1.5°F) is ideal.
Step-by-Step Guide
- Determine Temperature: Measure the outdoor temperature for AC systems, or indoor temperature for heating systems. Find this value on the horizontal axis of the chart.
- Find Corresponding Pressure: Draw a vertical line from the temperature to the saturation pressure curve. The intersection point represents the expected pressure.
- Compare with Gauges: Check your system’s pressure readings. Discrepancies between the chart and your gauges suggest potential issues.
Practical Applications
- Charging: The chart helps determine the correct refrigerant charge based on ambient temperature. Achieving proper superheat and subcooling is crucial for optimal performance.
- Troubleshooting: Abnormal pressure readings, interpreted using the chart, can pinpoint problems like leaks, overcharging, or component failures.
Superheat and Subcooling
These are crucial indicators of system health:
- Superheat: The temperature difference between refrigerant vapor and its saturation point. Aim for 10-25°F (measured near the compressor).
- Subcooling: The temperature difference between liquid refrigerant and its saturation point. Optimal subcooling ensures efficient heat transfer.
Different Chart Formats
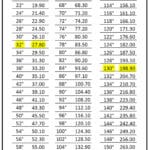
PT charts come in various forms – paper, digital, tables. While the format may differ, the purpose remains the same: illustrating the pressure-temperature relationship. Understanding the chart’s principles is essential, even with digital tools.
Safety First
Handle refrigerants cautiously. Wear appropriate safety gear, ensure proper ventilation, and consult safety guidelines. For complex problems, consult a qualified HVAC professional. They have the experience and tools needed to safely diagnose and resolve issues.
Decoding R410A Suction Line Temperatures: A Comprehensive Guide
The ideal R410A suction line temperature isn’t fixed; it varies based on ambient temperature, system load, and superheat. Aim for 10-25°F of superheat, measured near the compressor. Understanding this temperature is key to system optimization and troubleshooting.
Pressure-Temperature Relationship (The P-T Chart)
The P-T chart is crucial for interpreting suction line temperature. Using a pressure gauge, measure the suction line pressure and find the corresponding temperature on the R410A saturation curve of the chart. This helps determine the refrigerant state:
- Superheated Vapor: Measured temperature is higher than the saturation temperature.
- Saturated Mixture: Measured temperature equals the saturation temperature.
- Subcooled Liquid: Measured temperature is lower than the saturation temperature (less common in the suction line).
Calculating Superheat/Subcooling
- Superheat: Measured suction line temperature – Saturation temperature (from the P-T chart).
- Subcooling: Saturation temperature – Measured liquid line temperature.
Troubleshooting
Suction line temperature clues you in on potential issues:
- Low Temperature: Probably a refrigerant leak or a restricted metering device.
- High Temperature: May indicate an overcharged system, restricted airflow, or a failing compressor.
Factors Affecting Suction Line Temperature
Several factors influence suction line temperature:
- Ambient Temperature: Higher outdoor temperatures lead to higher suction line temperatures.
- System Load: Increased cooling demand results in higher temperatures.
- Airflow: Restricted airflow can elevate suction line temperature.
By understanding the interplay of these factors and utilizing the P-T chart, you can effectively diagnose and troubleshoot R410A system issues. Embark on a celestial journey with the impressive Orion SkyQuest XT8. For HVAC professionals, the R410A pressure chart high and low side is an essential tool.
- Long Haired Gray Cat Breeds: The Ultimate Guide - April 7, 2025
- How Many Days Until Feb 2: Accurate Countdown & Tool Guide - April 7, 2025
- Uncover the 7th Month: A Deep Dive into July’s History - April 7, 2025



2 thoughts on “Understanding the R410A PT Chart: A Practical Guide for HVAC Professionals”
Comments are closed.