Want to transform your students into reading detectives who can uncover hidden meanings and deeply understand any text? Inference anchor charts are the key! This comprehensive guide will show you how to create and use these powerful tools to boost reading comprehension in your classroom and beyond.
Decoding Inference: What It Is and Why It Matters
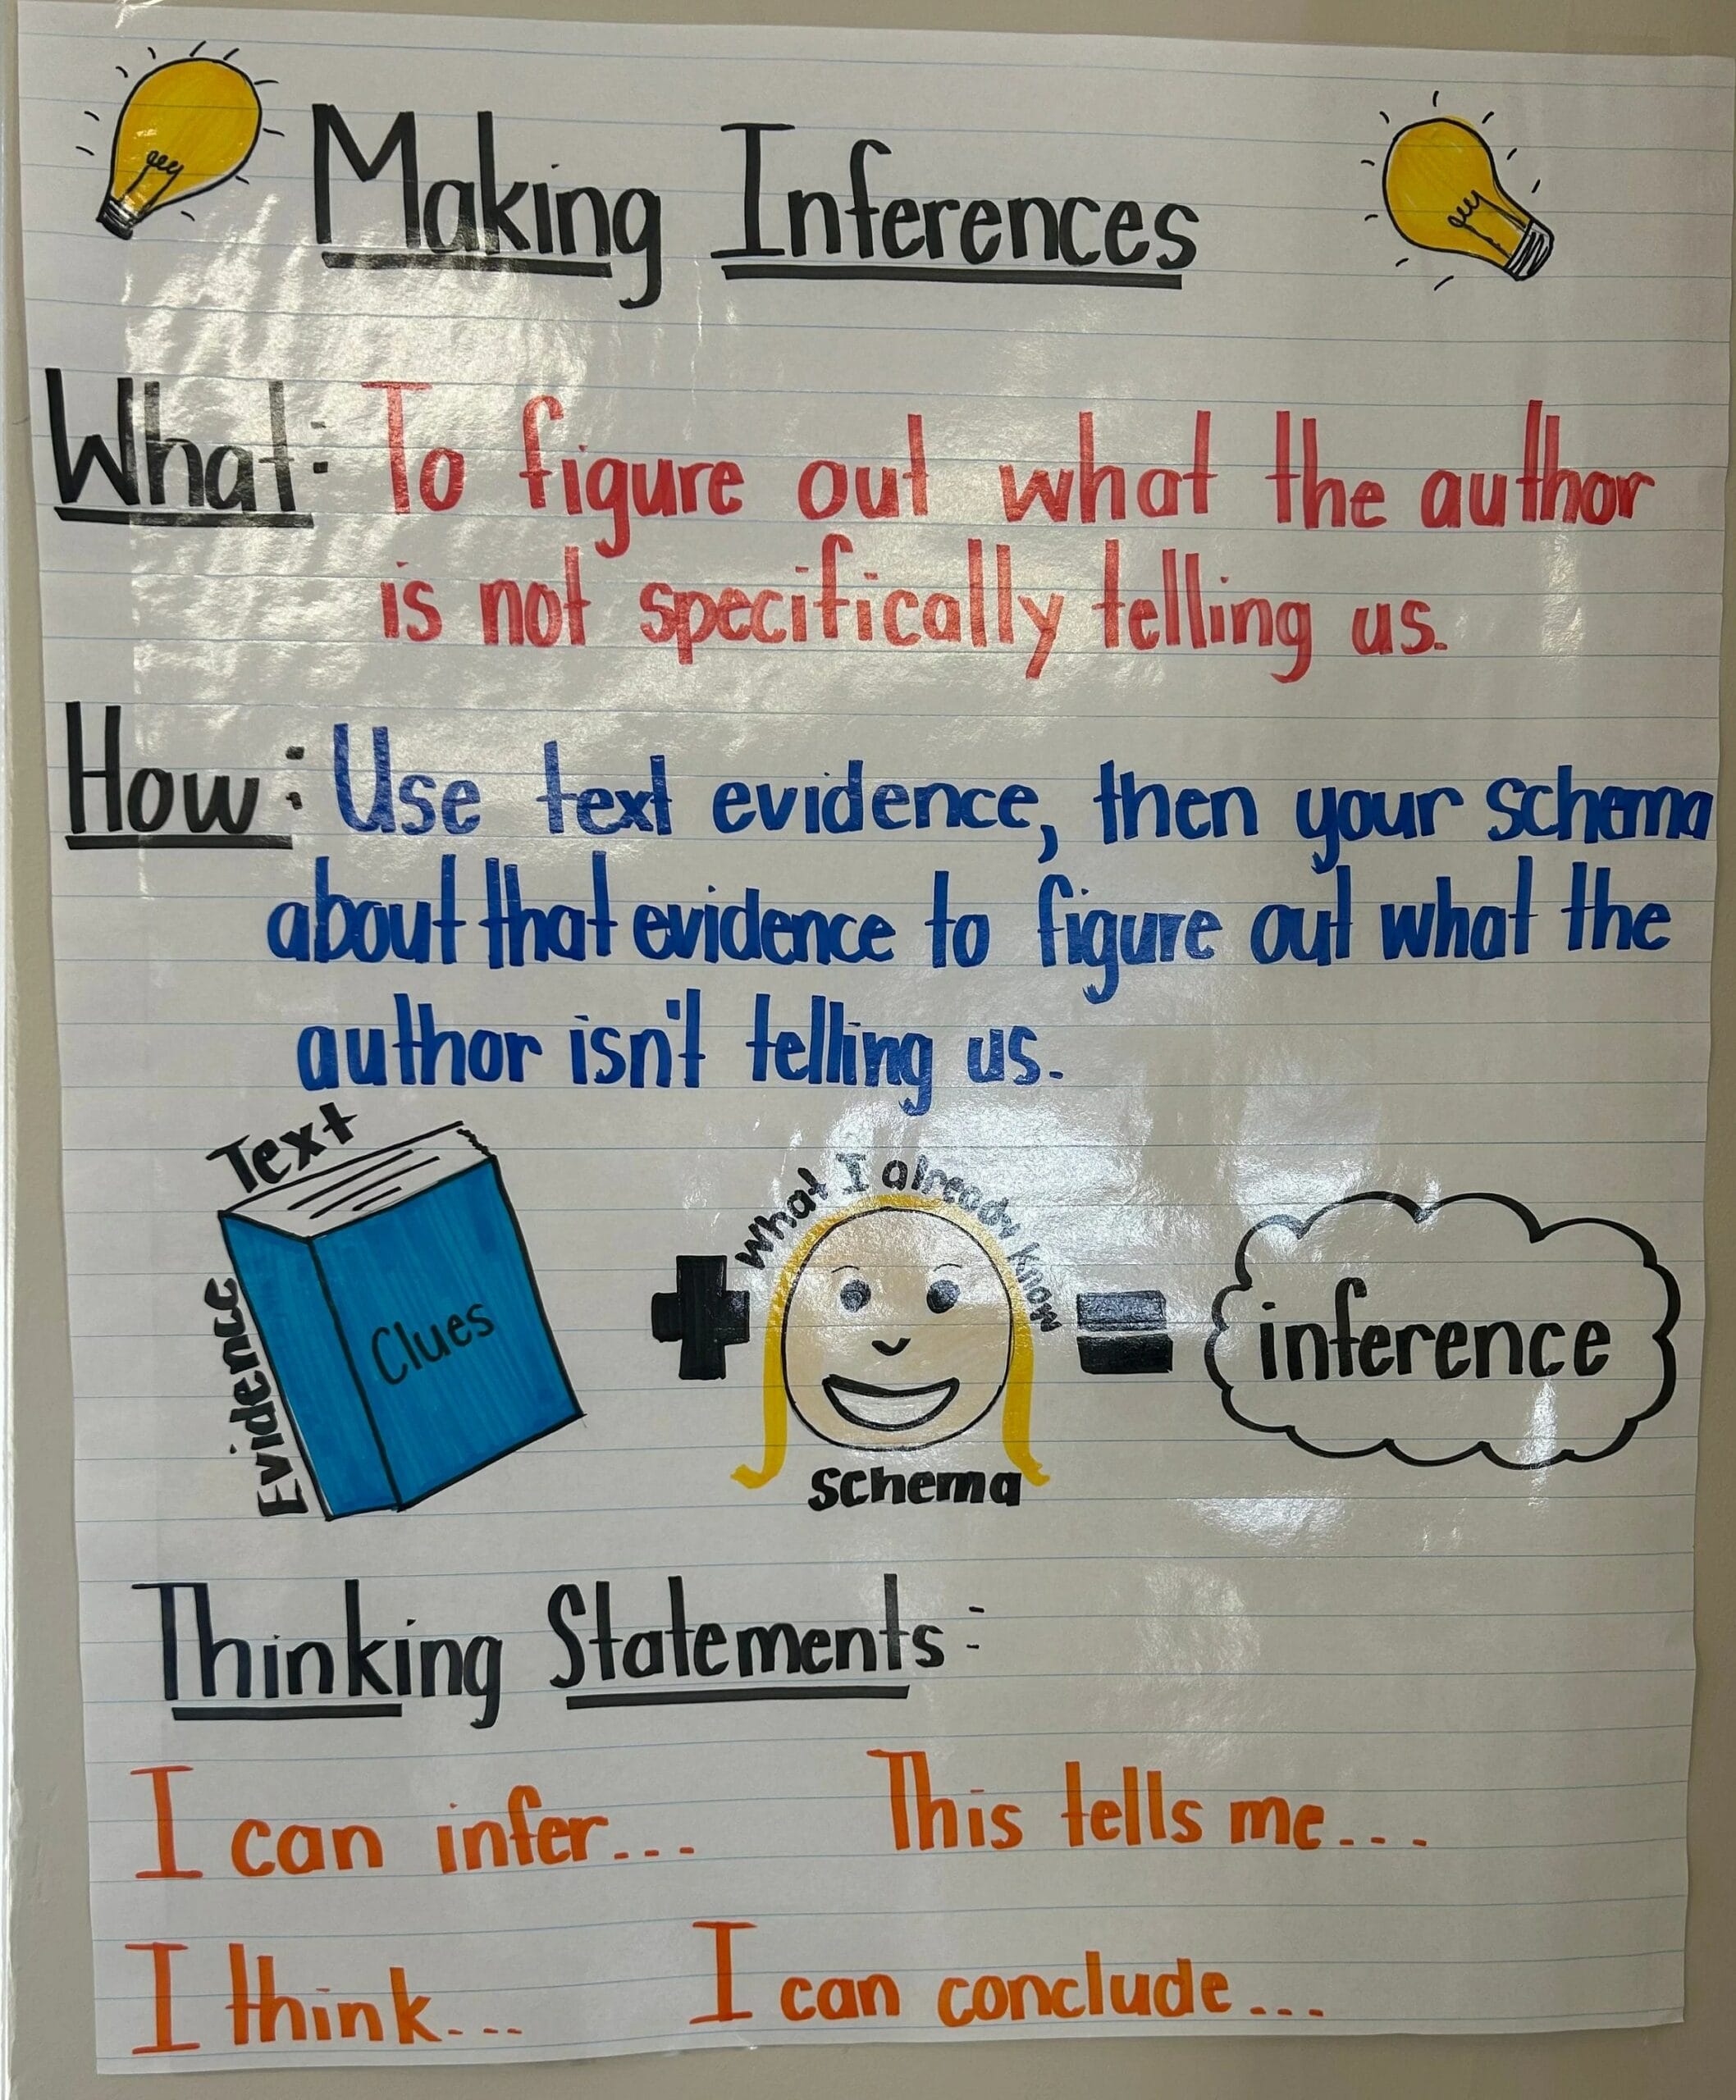
Inference is the magic of reading between the lines. It’s like being a detective, using clues from the text and your own background knowledge to figure out what the author doesn’t tell you directly. This essential skill helps readers connect the dots, draw conclusions, and truly grasp the deeper meaning of any text. It’s a crucial skill not just for academic success but also for navigating everyday life, from understanding news articles to interpreting social cues.
Building Your Own Inference Anchor Chart
Creating an effective inference anchor chart is easier than you think. Here’s a blueprint to guide you:
Step 1: Catchy Title: Start with a title that grabs attention. “Making Inferences Like a Detective” or “Unlocking Hidden Meanings” are great examples.
Step 2: Simple Definition: Explain inference in a way that everyone can understand. “Inference: Using clues from the text and what you already know to figure out what the author doesn’t tell you directly.”
Step 3: Real-World Examples: Connect inference to everyday experiences. “If you see someone carrying an umbrella, you can infer it’s probably raining even if you don’t see the rain itself.”
Step 4: Visual Power: Use images, symbols, and graphic organizers like magnifying glasses, question marks, thought bubbles, charts, and diagrams to make abstract ideas concrete.
Step 5: Interactive Elements: Include prompts like “What clues do you see?” or “What can you infer from this?” and leave space for student contributions.
Exploring Different Types of Inference Anchor Charts
Inference anchor charts can take various forms:
Definition-Focused Charts: Clearly explain what inference is and how it differs from observation, with contrasting examples.
Example-Driven Charts: Showcase a range of inferences from different texts, accompanied by the reasoning behind each one.
Strategy-Based Charts: Highlight specific strategies like using context clues, considering character actions, or analyzing the author’s tone.
Graphic Organizer Charts: Utilize flowcharts, mind maps, or T-charts to guide students through organizing their thoughts and connecting clues to conclusions.
Integrating Inference Anchor Charts into Your Lessons
Here’s how to make your anchor chart a dynamic learning tool:
Step 1: Introduction: Explain what inference is and why it’s important, making it relevant to real-life situations.
Step 2: Modeling: Choose a short text and demonstrate how to use the chart to make inferences, thinking aloud as you go.
Step 3: Guided Practice: Work together as a class to make inferences from another text, using the chart as a guide. Encourage discussion and collaboration.
Step 4: Independent Practice: Give students opportunities to practice independently, using the chart as a reference. Provide diverse texts and prompts.
Step 5: Review and Reinforcement: Regularly revisit the concepts on the chart and provide ongoing practice to solidify understanding.
Maximizing the Impact of Inference Anchor Charts
Here are more ways to harness the power of inference anchor charts:
Differentiation: Simplify charts for younger or struggling learners and provide more challenging prompts for advanced learners.
Assessment: Use charts to assess inferencing skills by asking students to explain their inferences and identify the clues they used.
Cross-Curricular Connections: Apply inference charts to science, social studies, math, and other subjects.
Digital Integration: Create interactive charts with clickable elements, videos, and quizzes using digital tools.
What is an Inference Chart? A Comprehensive Guide for Educators and Learners
While “inference chart” isn’t a formally defined term, it encompasses various visual organizers that aid the inferencing process. These charts help learners organize their thoughts, connect observations with background knowledge, and draw logical conclusions. They are powerful tools for improving reading comprehension, critical thinking, and problem-solving, applicable from elementary reading lessons to advanced research and everyday decision-making.
Inference charts can take various forms, including:
- T-charts: Compare observations and inferences side-by-side.
- Flowcharts: Illustrate the step-by-step inferencing process.
- Graphic organizers: Connect evidence to conclusions visually.
- Anchor charts (classroom-focused): Provide visual reminders of inferencing strategies.
Creating an Effective Inference Chart
Effective inference charts share key components:
- Clear headings: “Evidence,” “Background Knowledge,” “Inference”
- Visual cues: Arrows, connecting lines, symbols
- Concise language: Keywords and short phrases
- Flexibility: Adaptable to different needs
Creating Your Own Inference Chart
Step 1: Understanding Inference: Define inference: combining textual clues with background knowledge to form educated guesses about unstated information.
Step 2: Gathering Clues (Evidence): Extract key details and hints from the text.
Step 3: Activating Background Knowledge: Consider personal experiences and existing knowledge relevant to the text.
Step 4: Drawing Conclusions (Inference): Combine evidence and background knowledge to deduce likely meanings or scenarios.
Step 5: Visual Representation: Create your chart using a format that suits your purpose (T-chart, flowchart, graphic organizer), visually representing the connection between evidence and inference.
Mastering Inference: 5 Steps to Unlock Hidden Meaning in Text
Inference is more than just guessing; it’s a logical process of drawing conclusions based on textual evidence and reasoning. This skill is essential for understanding nuances, interpreting meaning, and fully appreciating any text.
The 5 Steps to Mastering Inference:
Step 1: Hunt for Clues: Carefully examine the text for significant details, words, phrases, descriptions, and actions. These are your clues!
Step 2: Tap into Your Background Knowledge: Connect the clues with your existing knowledge and experiences. This helps you understand the clues in context.
Step 3: Ask Questions: Interrogate the text. “Why did the character react that way?” “What might happen next?” Curiosity is key.
Step 4: Piece It Together: Form an Inference: Based on the clues and your knowledge, draw a reasonable conclusion. This is your inference – a logical deduction, not a wild guess.
Step 5: Back It Up! Support Your Inference: Cite specific textual evidence that supports your conclusion. This strengthens your inference and demonstrates thoughtful interpretation.
What is an Anchor Chart? Examples, Templates & Creative Uses in the Classroom
Anchor charts are dynamic visual tools used in classrooms to reinforce learning and promote student engagement. They are collaboratively created and serve as ongoing reference points for key concepts, procedures, and strategies. They’re more than just posters; they’re living documents that evolve with student understanding. Studies suggest student-created educational materials, like anchor charts, can lead to higher retention rates.
Types of Anchor Charts:
- Procedure Charts: Outline routines, expectations, and steps for classroom procedures (e.g., homework submission, fire drills).
- Strategy/Process Charts: Illustrate problem-solving steps or skill application (e.g., inferencing process, scientific method, math problem-solving steps).
- Content/Concept Charts: Visualize core concepts, vocabulary, and essential knowledge in a subject area (e.g., historical dates, grammar rules, literal equations, scientific terms).
Examples:
- Inference Anchor Charts: Guide inference-making with sentence starters like, “The text says… and I know… so I can infer…”
- Reading Comprehension Charts: Break down story elements, summarizing strategies, or other comprehension skills.
- Math Problem-Solving Charts: Outline steps for solving specific problems (like long division) or display key formulas. For instance, if you’re struggling with literal equations, our literal equations worksheet can be a great resource.
- Writing Process Charts: Visualize the stages of writing, from brainstorming to final draft.
Creating and Using Anchor Charts:
- Collaborative Creation: Involve students to foster engagement and ownership.
- Clear and Concise Design: Use color-coding, visuals, and keywords
- Prominent Display and Regular Use: Place charts where students can easily refer to them. Integrate them into lessons.
Anchor charts offer a dynamic and engaging way to support student learning, making abstract ideas tangible and empowering students to actively participate in their educational journey. They are a versatile tool for any classroom, adaptable across various subjects and learning styles.
- Discover Long Black Pepper: Flavor & Health Benefits - April 25, 2025
- Shocking Twists: The Grownup Review: Unreliable Narration - April 25, 2025
- A Quiet Place Book vs Movie: A Deep Dive - April 25, 2025


1 thought on “Unlocking Deeper Meaning: The Ultimate Guide to Using Inference Anchor Charts to Boost Reading Comprehension”
Comments are closed.