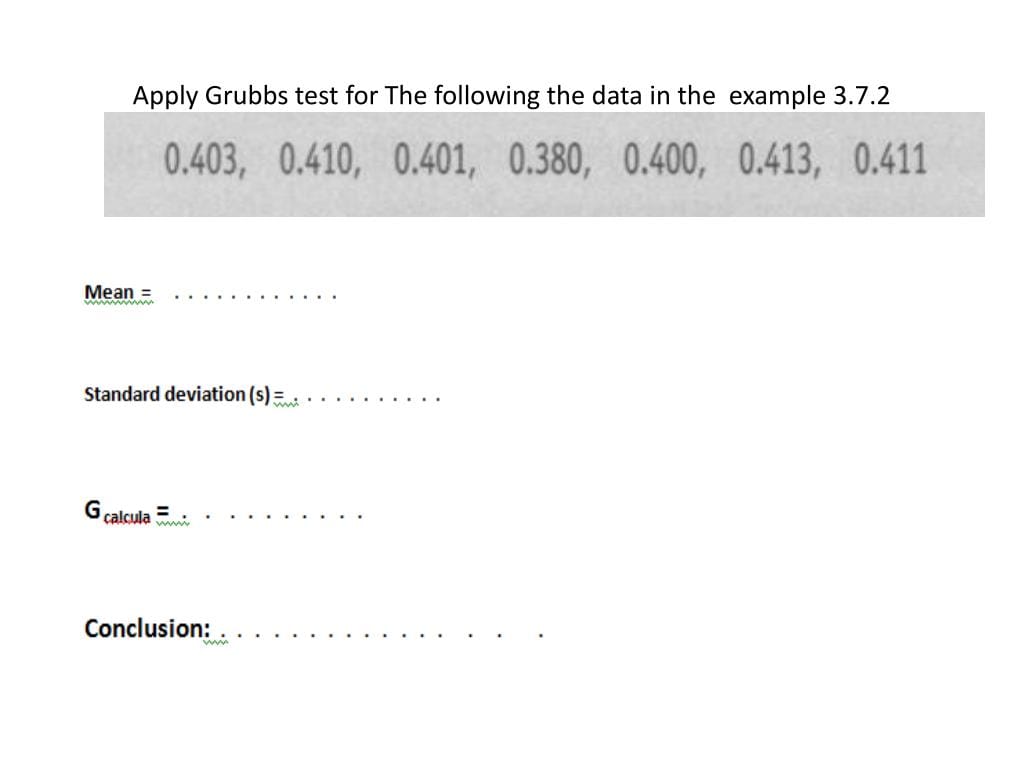
Ever dealt with a dataset where a few numbers just seem way off? These “odd numbers” are called outliers, and they can significantly impact your data analysis. Grubbs’ test helps you identify these outliers in normally distributed data. This guide provides a comprehensive walkthrough of Grubbs’ test, from its underlying principles to practical applications using software like R, Python, and Excel. By the end, you’ll be equipped to confidently detect outliers and ensure your analysis is robust and accurate.
Understanding Grubbs’ Test
Grubbs’ test, also known as the maximum normed residual test or extreme studentized deviate (ESD) method, acts as a statistical detective, helping you uncover outliers lurking within your data. These outliers can distort your results and lead to misleading conclusions. Grubbs’ test helps ensure your data is clean and ready for reliable analysis. It is particularly useful when you suspect a single outlier might be skewing your normally distributed data.
What is Grubbs’ Test?
Imagine a group of numbers mostly clustered together, resembling a bell-shaped curve (a normal distribution). However, one or two numbers might stray far from this central cluster. These are potential outliers. Grubbs’ test provides a statistical method to identify these unusual data points within a normally distributed dataset. It helps you confidently determine if a data point is so different from the others that it’s likely an outlier.
How Does Grubbs’ Test Work?
Grubbs’ test calculates a test statistic, “G,” which measures how far a suspected outlier lies from the data’s average (mean) relative to its spread (standard deviation). This quantifies how “unusual” a data point is. Then, this G value is compared to a critical value which depends on your dataset’s size and the desired confidence level (significance level, or alpha). If G exceeds the critical value, the test flags the data point as a potential outlier. Because Grubbs’ test is designed to detect one outlier at a time, it employs an iterative process. After identifying an outlier, the test removes it and repeats the process. This helps refine your data step by step, potentially revealing multiple layers of outliers.
Assumptions and Limitations
Before using Grubbs’ test, consider these important factors:
- Normality Assumption: Grubbs’ test assumes your data follows a normal distribution. Applying it to non-normally distributed data can lead to inaccurate results.
- Single Outlier Focus: The test is designed to detect one outlier at a time. It might not effectively detect clusters of multiple outliers.
- Sample Size: Grubbs’ test may be unreliable with very small datasets (typically fewer than six data points). Additionally, increasing the sample size increases the sensitivity of the test to small deviations, which could result in false positives.
- Iterative Effects: The iterative process of removing outliers can slightly influence the probability of identifying subsequent outliers.
Implementing Grubbs’ Test: A Step-by-Step Guide
- Visualize Your Data: Start by visualizing your data using scatter plots and box plots. This gives you an initial overview of the data distribution and highlights any visually apparent outliers.
- Calculate G: Compute the Grubbs’ test statistic (G) for the suspected outlier. Most statistical software packages automate this calculation.
- Determine the Critical Value: This value is based on the chosen significance level (alpha) and the sample size. Refer to pre-calculated tables or use statistical software.
- Compare G and Critical Value: If the calculated G value is greater than the critical value, the data point is likely an outlier.
- Iterate (If Necessary): If an outlier is found, remove it from the dataset, re-calculate G and the critical values using the adjusted sample size, and repeat steps 2-4 to identify any other potential outliers.
Grubbs’ Test with Software
Fortunately, manual calculations aren’t necessary. Various software packages simplify the process:
- R: The
grubbs.test()function in theoutlierspackage makes performing Grubbs’ test straightforward. - Python: The
scipy.statslibrary offers functions for Grubbs’ test. - Excel: While Excel lacks a built-in Grubbs’ test function, you can perform it manually using formulas or leverage add-ins like XLSTAT or the Real Statistics Resource Pack. These add-ins also offer the Double Grubbs’ test for detecting two outliers simultaneously.
- Online Calculators: Numerous online calculators are readily available for quick and easy Grubbs’ test calculations.
- GraphPad: GraphPad Prism also offers Grubbs’ test functionality.
See our detailed guides for implementing Grubbs’ test in Excel and using R.
Exploring Alternative Outlier Detection Methods
What if your data isn’t normally distributed or you suspect multiple outliers? Consider these alternatives:
- ROUT Test: Suitable for non-normally distributed data.
- Dixon’s Q Test: Useful, particularly with smaller datasets, but less robust with growing sample sizes and normally distributed data.
- Tietjen-Moore Test: Useful when you expect multiple outliers.
- Generalized Extreme Studentized Deviate (GESD) Test: More robust for normally distributed data with multiple outliers than Grubbs’ Test.
Choosing the right test depends on your data’s characteristics and the specific research question. Consider consulting a statistician for complex scenarios. A comparative overview of different outlier tests can be found here.
| Test | Strengths | Weaknesses | Best For… |
|---|---|---|---|
| Grubbs’ Test | Excellent for single outliers in normally distributed data | Assumes normality, one outlier at a time | Single outliers, normally distributed data |
| Dixon’s Q Test | Simple to use for small datasets | Less reliable with larger datasets | Small samples, potential outliers at the extremes |
| ROUT Test | Works well with non-normal data | Can be computationally intensive | Non-normal data, possibility of multiple outliers |
| Tietjen-Moore Test | Effective for detecting multiple outliers in normally distributed data | Assumes normality | Normally distributed data, multiple outliers |
Applications of Grubbs’ Test
Grubbs’ test finds applications across various fields:
- Quality Control: Detecting faulty equipment or processes.
- Environmental Monitoring: Identifying unusual pollution levels.
- Financial Analysis: Spotting irregular transactions.
- Medical Research: Identifying anomalous patient responses.
Sample Size Considerations for Grubbs’ Test
While Grubbs’ test can technically function with a minimum of three data points, a larger sample size (preferably above 30) generally enhances its reliability and aligns with recommendations for similar tests like Dixon’s Test. With larger datasets, however, Grubbs’ test becomes more sensitive, potentially flagging minor deviations as outliers. Therefore, careful interpretation of results is crucial, considering the practical significance of identified outliers. For smaller sample sizes (below 30), Dixon’s test might offer a more suitable alternative. For a detailed discussion on sample size considerations, refer to our dedicated article on sample size for Grubbs’ test.
Correctly Citing Your Sources
Proper citation is essential for academic integrity. Learn more about accurate referencing using resources like the Purdue OWL.
Leveraging Data-Driven Insights
Enhance your data analysis with comprehensive assessment platforms like aimsweb, which provide tools for robust data interpretation and decision-making.
By understanding Grubbs’ test’s principles, limitations, and practical applications, you can effectively identify outliers, ensure data integrity, and draw reliable conclusions from your analyses. Remember that ongoing research continually refines outlier detection methods and best practices. Stay informed about the latest developments to maximize the accuracy and robustness of your data analysis.
- Unveiling the Enigma: Mansoureh Khojasteh Bagherzadeh’s Public Appearances & Private Life in Iran - July 18, 2025
- Unveiling the Mystery: Mansoureh Khojasteh Bagherzadeh’s Husband: A Rare Glimpse into a Private Life - July 18, 2025
- Unveiling Masoud Khamenei’s Mother: Power, Influence, and Iran’s Future - July 18, 2025


2 thoughts on “A Comprehensive Guide to Grubbs’ Outlier Test: Identifying and Handling Outliers in Normal Distributions”
Comments are closed.