Unleash your inner math whiz! This comprehensive guide dives deep into the world of graphing linear inequalities, equipping you with everything from printable worksheets and answer keys to engaging video tutorials. Whether you’re a student aiming for an A+ or a teacher seeking top-notch resources, this guide is your one-stop shop for conquering linear inequalities.
Deciphering Linear Inequalities
Linear inequalities may sound intimidating, but they’re surprisingly straightforward. They build upon the familiar concept of linear equations, adding a layer of comparison. This guide breaks down everything you need to know, from the basics to practical applications.
What are Linear Inequalities?
Linear inequalities are mathematical statements comparing two expressions using symbols like less than (<), greater than (>), less than or equal to (≤), and greater than or equal to (≥). These symbols indicate a relationship where one side is bigger, smaller, or possibly equal to the other, but not exactly equal. Think of real-world scenarios like “I need at least 5 ingredients for this recipe” or “This elevator can hold no more than 10 people.” These “at least” and “no more than” situations are where inequalities shine.
Forms of Linear Inequalities
Just like linear equations, inequalities come in different forms:
- Slope-intercept form:
y < mx + b(or other inequality symbols). This is generally the most user-friendly form for graphing. - Standard form:
Ax + By ≤ C(or other inequality symbols). This form may require some rearranging before graphing. - Point-slope form:
y - y1 > m(x - x1)(or other inequality symbols). Useful when you know a point and the slope.
Why Visualize with Graphs?
Representing linear inequalities graphically provides powerful insights:
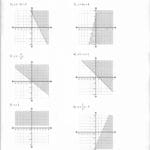
- See the Solutions: A graph instantly reveals all possible solutions. The shaded region represents the solution set – every point within that area satisfies the inequality.
- Real-World Relevance: Businesses use them for resource allocation, engineers for defining safe limits, and economists for modeling constraints.
- Problem-Solving Boost: Imagine planning a party with a budget for food and drinks. Graphing can help you visualize affordable combinations.
- Foundation for Advanced Math: Mastering linear inequalities is essential for more complex topics like systems of inequalities and linear programming.
Graphing Linear Inequalities: A Step-by-Step Tutorial
Let’s transform those algebraic expressions into visual solutions. This guide provides a practical, step-by-step approach to graphing linear inequalities. [https://www.lolaapp.com/graphing-inequalities-worksheet]
Prepare Your Inequality (Slope-Intercept Form): Rewrite the inequality in slope-intercept form (y < mx + b or similar). This simplifies graphing. For example, convert
2x + y < 5toy < -2x + 5.Draw the Boundary Line: Graph the line as if it were an equation (replace the inequality symbol with =). This line separates solutions from non-solutions.
Solid or Dashed?: Use a solid line for ≤ or ≥ (inclusive) and a dashed line for < or > (exclusive). A solid line means points on the line are included in the solution.
Test a Point: Pick a point not on the line (e.g., (0,0)). Substitute its coordinates into the original inequality.
Shade the Solution Zone: If the test point makes the inequality true, shade the region containing the point. Otherwise, shade the opposite region.
| Step | Action | Example (y < -2x + 5) |
|---|---|---|
| 1 | Rewrite in slope-intercept form | Already in this form |
| 2 | Graph the line as an equation | y = -2x + 5 |
| 3 | Solid line (≥, ≤) or dashed line (>, <) | Dashed line |
| 4 | Test a point (e.g., (0,0)) | 0 < -2(0) + 5 (True) |
| 5 | Shade the appropriate region | Shade below the line |
While these steps are well-established, ongoing research suggests that students often struggle with the conceptual understanding behind them. Further studies are exploring new teaching methods to address these challenges. This guide aims to provide a clear path, but remember, the field is constantly evolving.
Free Printable Worksheets & Answer Keys: Practice Makes Perfect
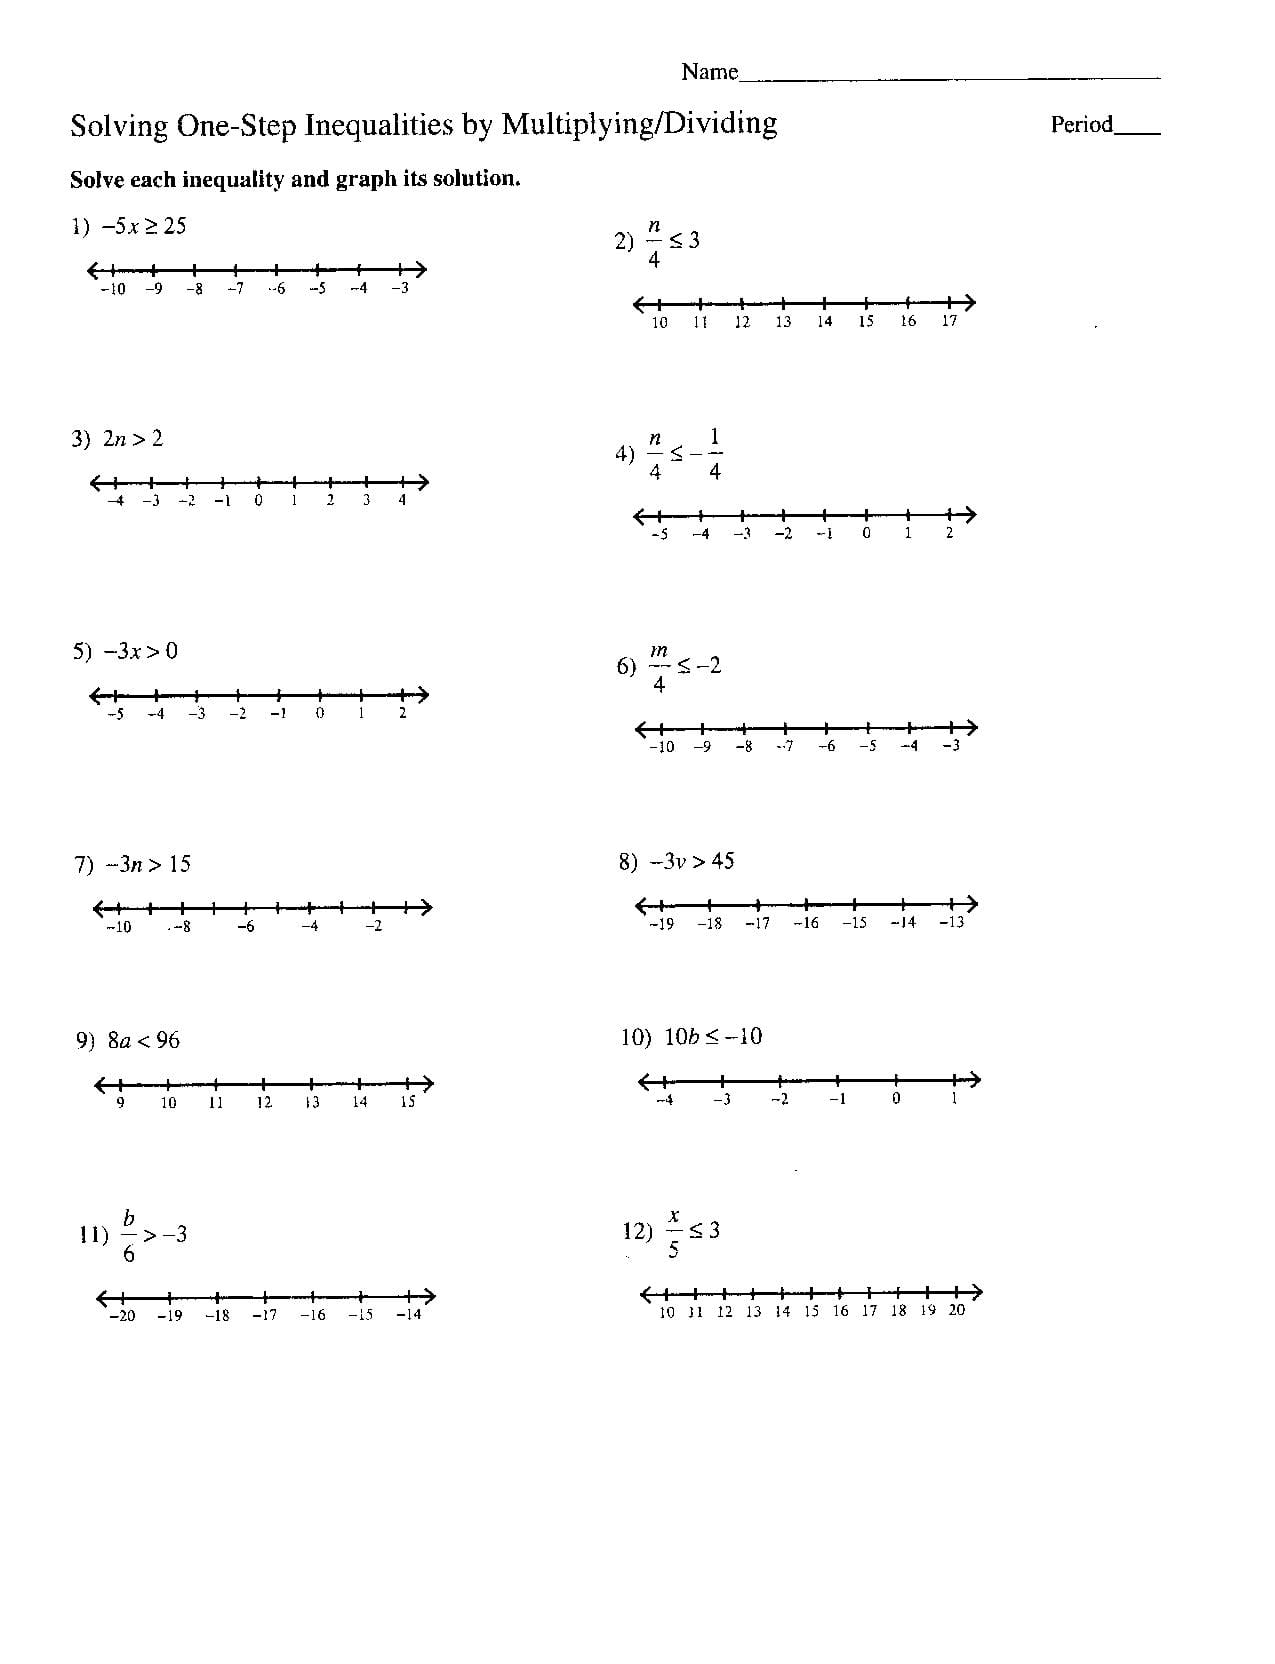
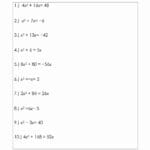
Ready to put your knowledge into action? Printable worksheets offer a practical and cost-effective way to hone your skills. [https://www.lolaapp.com/graphing-inequalities-worksheet] These worksheets cater to various skill levels, from basic to advanced, and come with answer keys for immediate feedback.
Using the Worksheets:
Rearrange: Isolate ‘y’ on the left side of the inequality.
Graph: Graph the line, making it solid for ≤/≥ and dashed for .
Test: Choose a test point not on the line and substitute its coordinates.
Shade: Shade the appropriate region based on whether the test point satisfies the inequality.
Printable worksheets are a fantastic starting point, but the world of math learning is constantly expanding. Some experts suggest supplementing with interactive tools and online platforms for a more dynamic and personalized learning experience. Explore different resources and find what works best for you!
Interactive Graphing: Desmos and GeoGebra
Take graphing to the next level with interactive tools like Desmos and GeoGebra. These dynamic platforms bring inequalities to life, allowing you to visualize solutions and explore concepts in a more engaging way.
Advantages of Interactive Tools:
- Instant Feedback: See how changes to the inequality affect the graph in real time.
- Deeper Understanding: Go beyond memorization and build intuition about solution sets.
- Engaging Activities: Explore pre-made activities and applets for interactive learning.
Desmos:
- Multiple Inequalities: Graph multiple inequalities simultaneously and see overlapping solutions.
- Activity Builder: Create custom interactive lessons and exercises.
- Sliders & Animations: Manipulate inequality parameters dynamically.
GeoGebra:
- Interactive Applets: Access a library of pre-built resources for exploring inequality concepts.
- Targeted Practice: Find applets designed specifically for graphing linear inequalities.
While these are powerful tools, the field of educational technology is always evolving. Ongoing research and development likely suggest even more innovative tools will emerge in the future.
Real-World Applications: Beyond the Classroom
Linear inequalities are more than just theoretical concepts. They have practical applications across diverse fields:
- Business: Optimizing resource allocation, maximizing profits, determining pricing strategies.
- Engineering: Defining design constraints, ensuring structures meet safety limits, optimizing complex systems.
- Economics: Modeling supply and demand, analyzing market behavior, predicting economic trends.
| Field | Application | How Linear Inequalities Help |
|---|---|---|
| Personal Finance | Creating a budget | Staying within your income limits |
| Nutrition | Planning a balanced diet | Meeting nutrient requirements without exceeding calorie goals |
| Manufacturing | Optimizing production | Maximizing output with limited resources |
Linear inequalities offer precise modeling, inform decisions, and simplify complex problems. However, they don’t always capture every real-world nuance. Unforeseen factors can influence outcomes, and solutions often present a range of possibilities rather than a single answer. Ongoing research explores refining these models and incorporating probabilities for increased accuracy. Linear inequalities provide a powerful starting point, but the quest for perfectly modeling the real world is an ongoing journey.
- Discover Long Black Pepper: Flavor & Health Benefits - April 25, 2025
- Shocking Twists: The Grownup Review: Unreliable Narration - April 25, 2025
- A Quiet Place Book vs Movie: A Deep Dive - April 25, 2025




1 thought on “Graphing Linear Inequalities Worksheets: Free Printables with Answer Keys (Plus Video Tutorials!)”
Comments are closed.