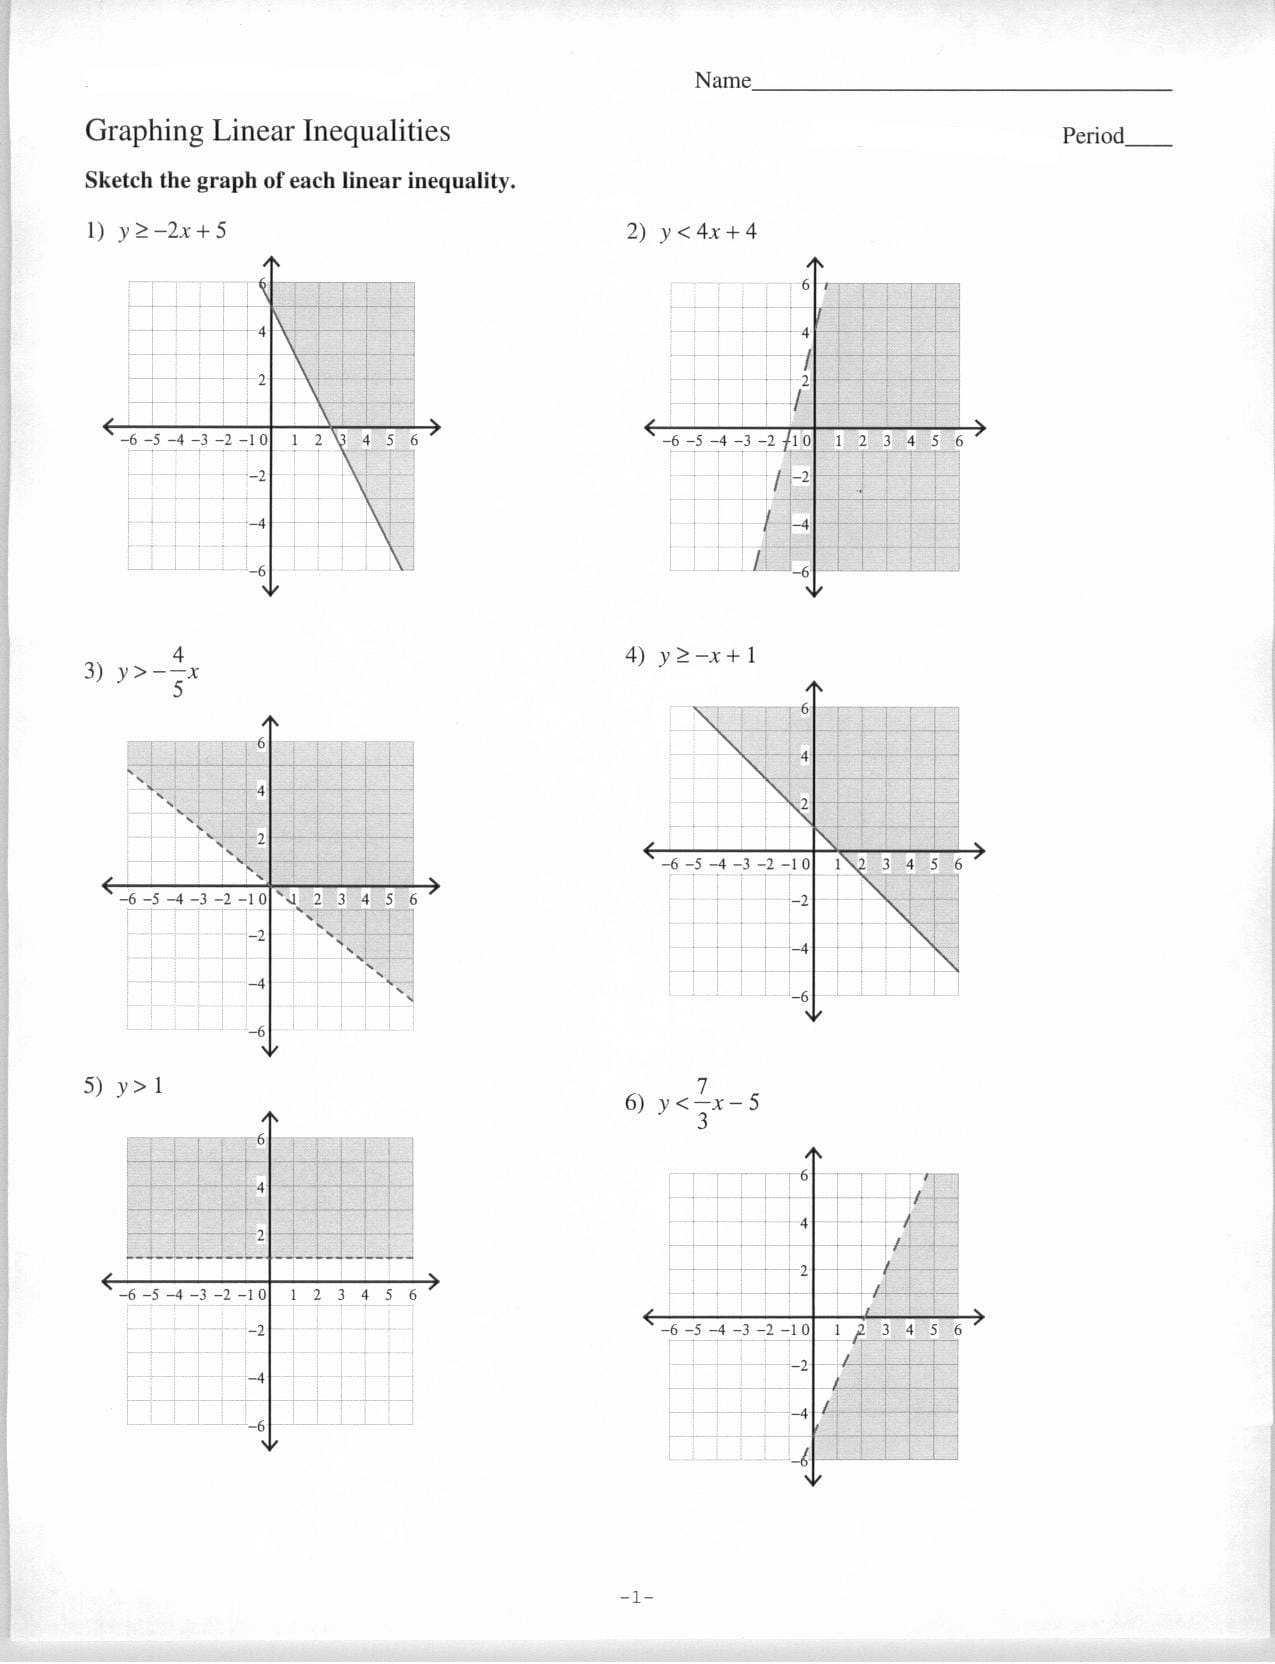
Hey there, future math wizards! Ready to conquer the world of graphing inequalities? This guide is your trusty sidekick, breaking down everything from the basics to advanced tricks, just like having a personal math tutor. We’ll explore different types of inequalities, show you how to shade like a pro, and even tackle systems of inequalities. Plus, we’ve got a treasure trove of free printable worksheets and engaging video tutorials to make learning a blast. Let’s get started!
Decoding Inequalities: A Visual Journey
Graphing inequalities is simply a visual way of showing all the possible solutions to an inequality equation. Instead of just one answer, you get a whole region of possibilities! This guide will equip you with the tools to understand and master this essential algebra concept.
Inequality Types: Choosing Your Tools
Think of different inequalities like different art supplies – each creates a unique effect.
Linear Inequalities: These involve straight lines, like drawing with a ruler. They typically appear as
y > mx + b. You’ll draw a line and shade one side—the shaded area represents all possible solutions. If you’re struggling with these, check out our helpful graphing linear inequalities worksheet.Quadratic Inequalities: These involve curves, like the arc of a basketball shot. They’re usually in the form
y > ax^2 + bx + c. You’ll draw a curved line and shade one side of the curve where the solutions lie.Absolute Value Inequalities: These measure distance from zero, like ripples spreading out from a pebble dropped in water. They often look like
|x| > a. You’ll shade everything outside a certain distance from a point.
Graphing Inequalities: A Step-by-Step Adventure
Let’s build our graphing skills step by step, like constructing a magnificent LEGO masterpiece.
Step 1: The Boundary Line (Your Foundation)
First, identify your inequality type (linear, quadratic, absolute value). Draw the corresponding line or curve as if it were an equation. This is your boundary line, the dividing line between possible solutions and non-solutions.
For “less than or equal to” (≤) or “greater than or equal to” (≥), use a solid line—like a solid LEGO brick, points on the line are included. For “less than” (<) or “greater than” (>), use a dashed line—like a dotted line, points on the line are not included.
Step 2: The Test Point (Checking the Fit)
Pick any point not on your boundary line. Substitute its coordinates (x and y values) into the inequality. If the inequality holds true, shade the side containing the point. If it’s false, shade the other side.
Step 3: The Slope Shortcut (For Linear Inequalities)
For linear inequalities, a positive slope (uphill) generally suggests shading above the line for “greater than” and below for “less than.” A negative slope (downhill) usually suggests the opposite. While a helpful trick, always double-check with a test point!
Shading and Lines: Decoding the Map
Shaded Regions: The shaded area represents all points satisfying the inequality, like highlighting all the correct answers.
Boundary Lines: Solid lines include points on the line as part of the solution, dashed lines exclude them. Think of it like a property line—sometimes the fence is part of your property, sometimes it isn’t.
Horizontal and Vertical Lines: For horizontal (y = c) and vertical (x = c) lines, the rules still apply! Draw the line and shade the appropriate side. For example,
y < 2would be a dashed horizontal line at y=2, shaded below the line.
Systems of Inequalities: Overlapping Solutions
A system of inequalities is two or more inequalities considered together. Graph each inequality separately on the same coordinate plane. The overlapping shaded region represents the solution to the system – the sweet spot where all conditions are met.
Solving Inequalities: Unmasking the Range
So, you’re facing an inequality? Don’t worry, they’re just equations with a twist! Instead of one precise solution, we find a range of values that make the statement true.
Step-by-Step Solution: Your Inequality Toolkit
Decipher the Symbol: Identify the inequality symbol (<, >, ≤, ≥). This dictates the direction of your solution set.
Isolate the Variable: Use algebraic operations (add, subtract, multiply, divide) to isolate the variable. Important: Flip the inequality sign if you multiply or divide by a negative number.
Solve (Almost): Treat the inequality as an equation and solve. This value marks the boundary of your solution set.
Double-Check: Substitute a value from your proposed solution range back into the original inequality. Does it hold true? This check can quickly prevent mistakes.
Visualize on a Number Line: Draw a number line, mark the solution point (open circle for < or >, closed circle for ≤ or ≥), and shade the appropriate direction (left for “less than,” right for “greater than”). This visualization brings the solution set to life.
Example: 2x + 3 < 7
- Symbol: < (less than)
- Isolate: Subtract 3 from both sides: 2x < 4. Divide by 2: x < 2
- Solve: x = 2 (as an equation)
- Check: x = 0. 2(0) + 3 < 7 → 3 < 7 (True)
- Graph: Open circle at 2, shade to the left.
Tricky Situations: Fractions, Decimals, and More
Inequalities might sometimes throw curveballs like fractions or decimals. Stick to the fundamental rules, and you’ll navigate them with ease. Consistent practice is key. Ongoing research always explores better teaching methods for these concepts, so keep an open mind to new approaches.
Resources: Your Knowledge Boosters
Learning doesn’t stop here! Here are some fantastic resources to deepen your understanding and practice your graphing skills:
Worksheets:
- Kuta Software: Excellent for targeted practice on various inequality types.
- Math Worksheets 4 Kids: Comprehensive worksheets for different grade levels.
- Corbettmaths: Practice questions and video tutorials for extra support.
- Mr Barton Maths: Worksheets with horizontal/vertical lines and unshaded regions.
- Easy Teacher Worksheets: Simple and effective printables for linear inequalities.
- MME Revise: Revision materials to solidify your understanding.
Video Tutorials:
- Khan Academy: Engaging videos explaining graphing inequalities clearly.
- MrJSaintGermain: Focused video lessons on linear inequality graphing.
- YouTube Channels: Search for “graphing inequalities tutorial” for a wealth of resources, including those using Kuta Software.
Beyond the Basics: Stretching Your Skills
Want to delve deeper? Explore interactive online tools that let you manipulate graphs and see how changes affect the solution sets. Understanding common mistakes (like shading the wrong region) is crucial. You can even venture into advanced topics like systems of nonlinear inequalities and connect these skills to real-world applications like linear programming and optimization problems.
With practice and the right resources, graphing inequalities will become second nature. So, grab your pencils (or styluses), embrace the challenge, and become a graphing inequalities guru!


