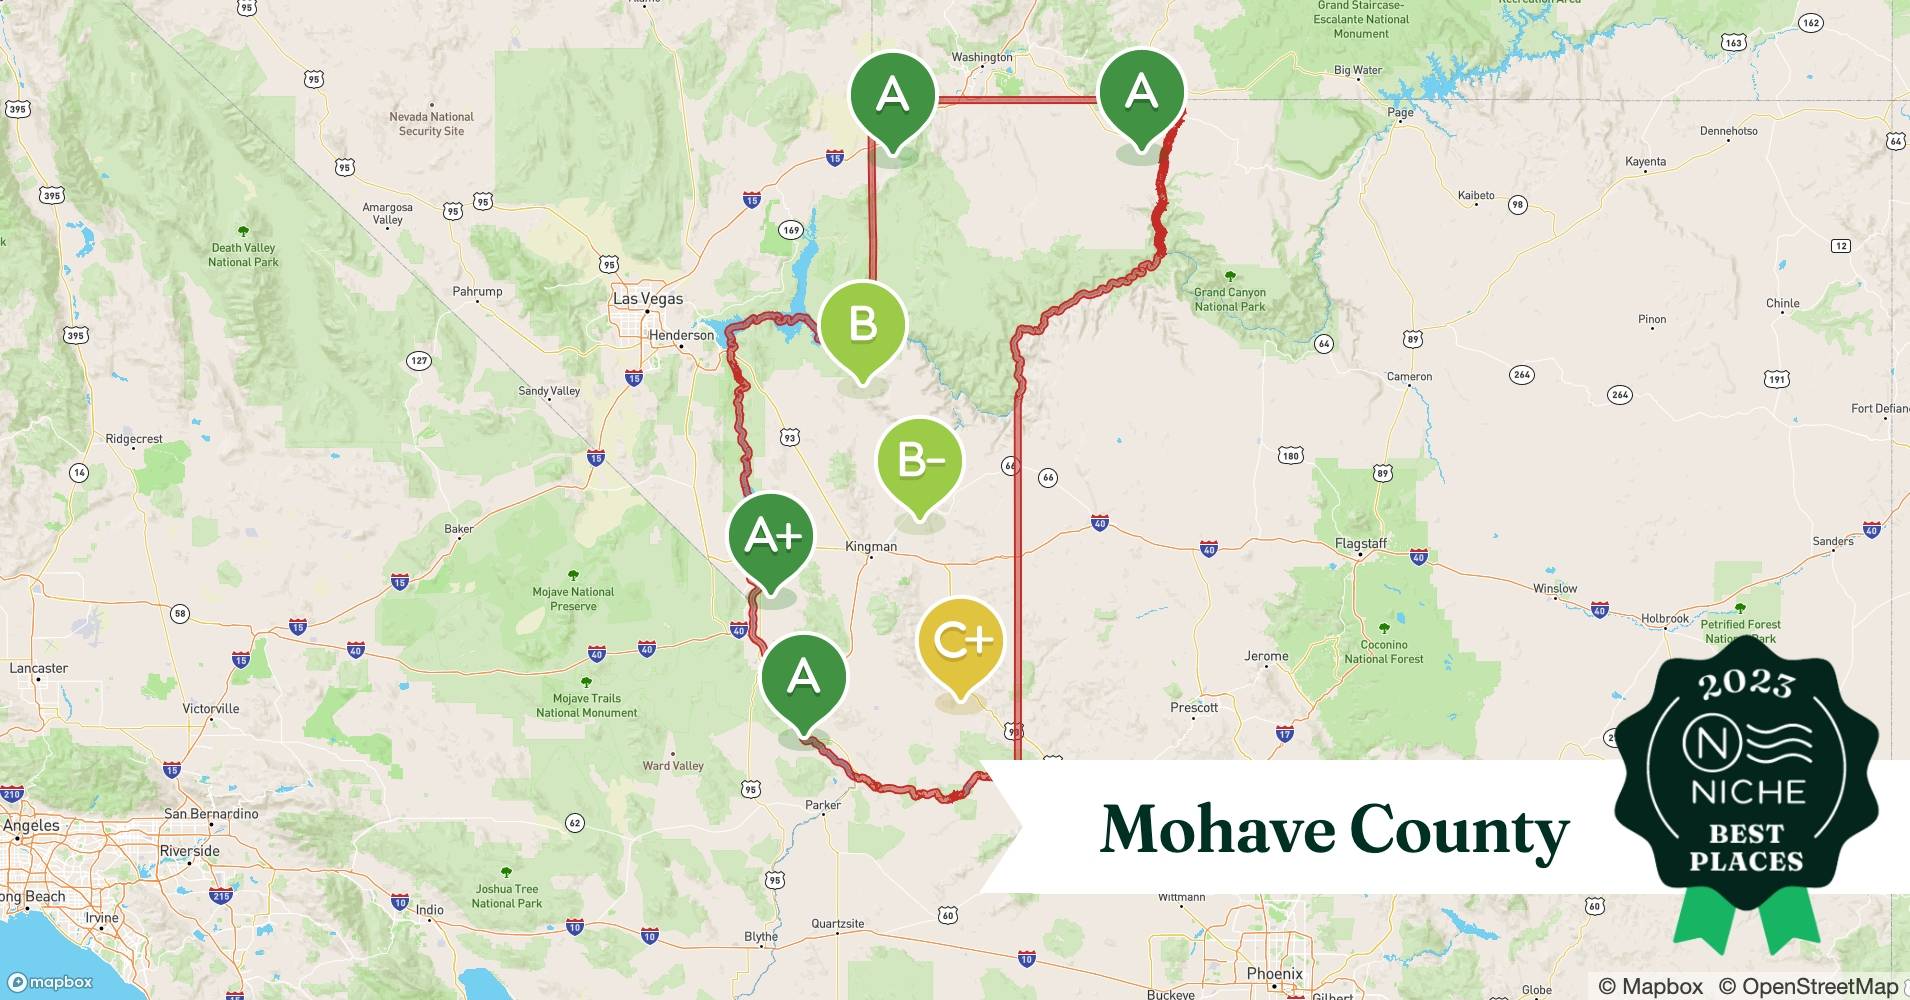
Mohave County, with its expansive landscapes and diverse communities, faces unique challenges and opportunities. How do we plan for sustainable growth, manage precious resources, and respond effectively to emergencies? A key part of the answer lies within Geographic Information Systems, or GIS. This article explores how Mohave County leverages interactive maps and data for smarter decision-making, from planning new developments to safeguarding our natural resources.
Exploring Mohave County Through a Digital Lens
Exploring Mohave County Through a Digital Lens
Imagine having x-ray vision for your region, revealing hidden patterns and crucial connections. That’s the power of GIS. It’s more than just creating maps; it’s about harnessing location-based data to gain valuable insights. By combining layers of information like property lines, roads, elevation, demographics, and environmental factors, GIS helps us understand how different elements interact. For instance, it can reveal how a new development might affect traffic flow or identify areas at high risk for wildfires.
Understanding GIS in Mohave County
GIS in Mohave County isn’t just about pretty maps (though it creates those too!). It’s a powerful toolkit for making informed decisions about our community’s future. This technology combines various data layers, such as property lines, roads, elevation, demographics, and environmental characteristics, presenting them geographically. This layered approach reveals how different elements relate and offers critical insights. For example, GIS might demonstrate how traffic flow could be impacted by a new development or pinpoint areas especially susceptible to wildfires.
Accessing Mohave County’s Geospatial Data
Mohave County offers easy access to its GIS data through two key platforms:
Public Map Viewer (mohave.gov)
This interactive map provides a quick, visual overview of county information. Need to check zoning regulations for a property or find the nearest county park? The Public Map Viewer likely utilizes robust software like Geocortex Essentials to give you fast, user-friendly access.
Open Data Portal (az-mohave.opendata.arcgis.com)
For those seeking raw data and in-depth analysis, the Open Data Portal is a treasure trove. It offers downloadable datasets in formats like CSV, KML, Zip, GeoJSON, GeoTIFF, and PNG, catering to users from casual map enthusiasts to professional data analysts. Developers can also integrate this data into their own applications using the portal’s APIs for GeoServices, WMS, and WFS.
| Platform | Purpose | Data Formats | Ideal User |
|---|---|---|---|
| Public Map Viewer | Interactive map exploration | Visual (no downloads) | Residents, general public |
| Open Data Portal | Data downloads and API access | CSV, KML, Zip, GeoJSON, GeoTIFF, PNG | Developers, researchers, data analysts |
Who Benefits from GIS?
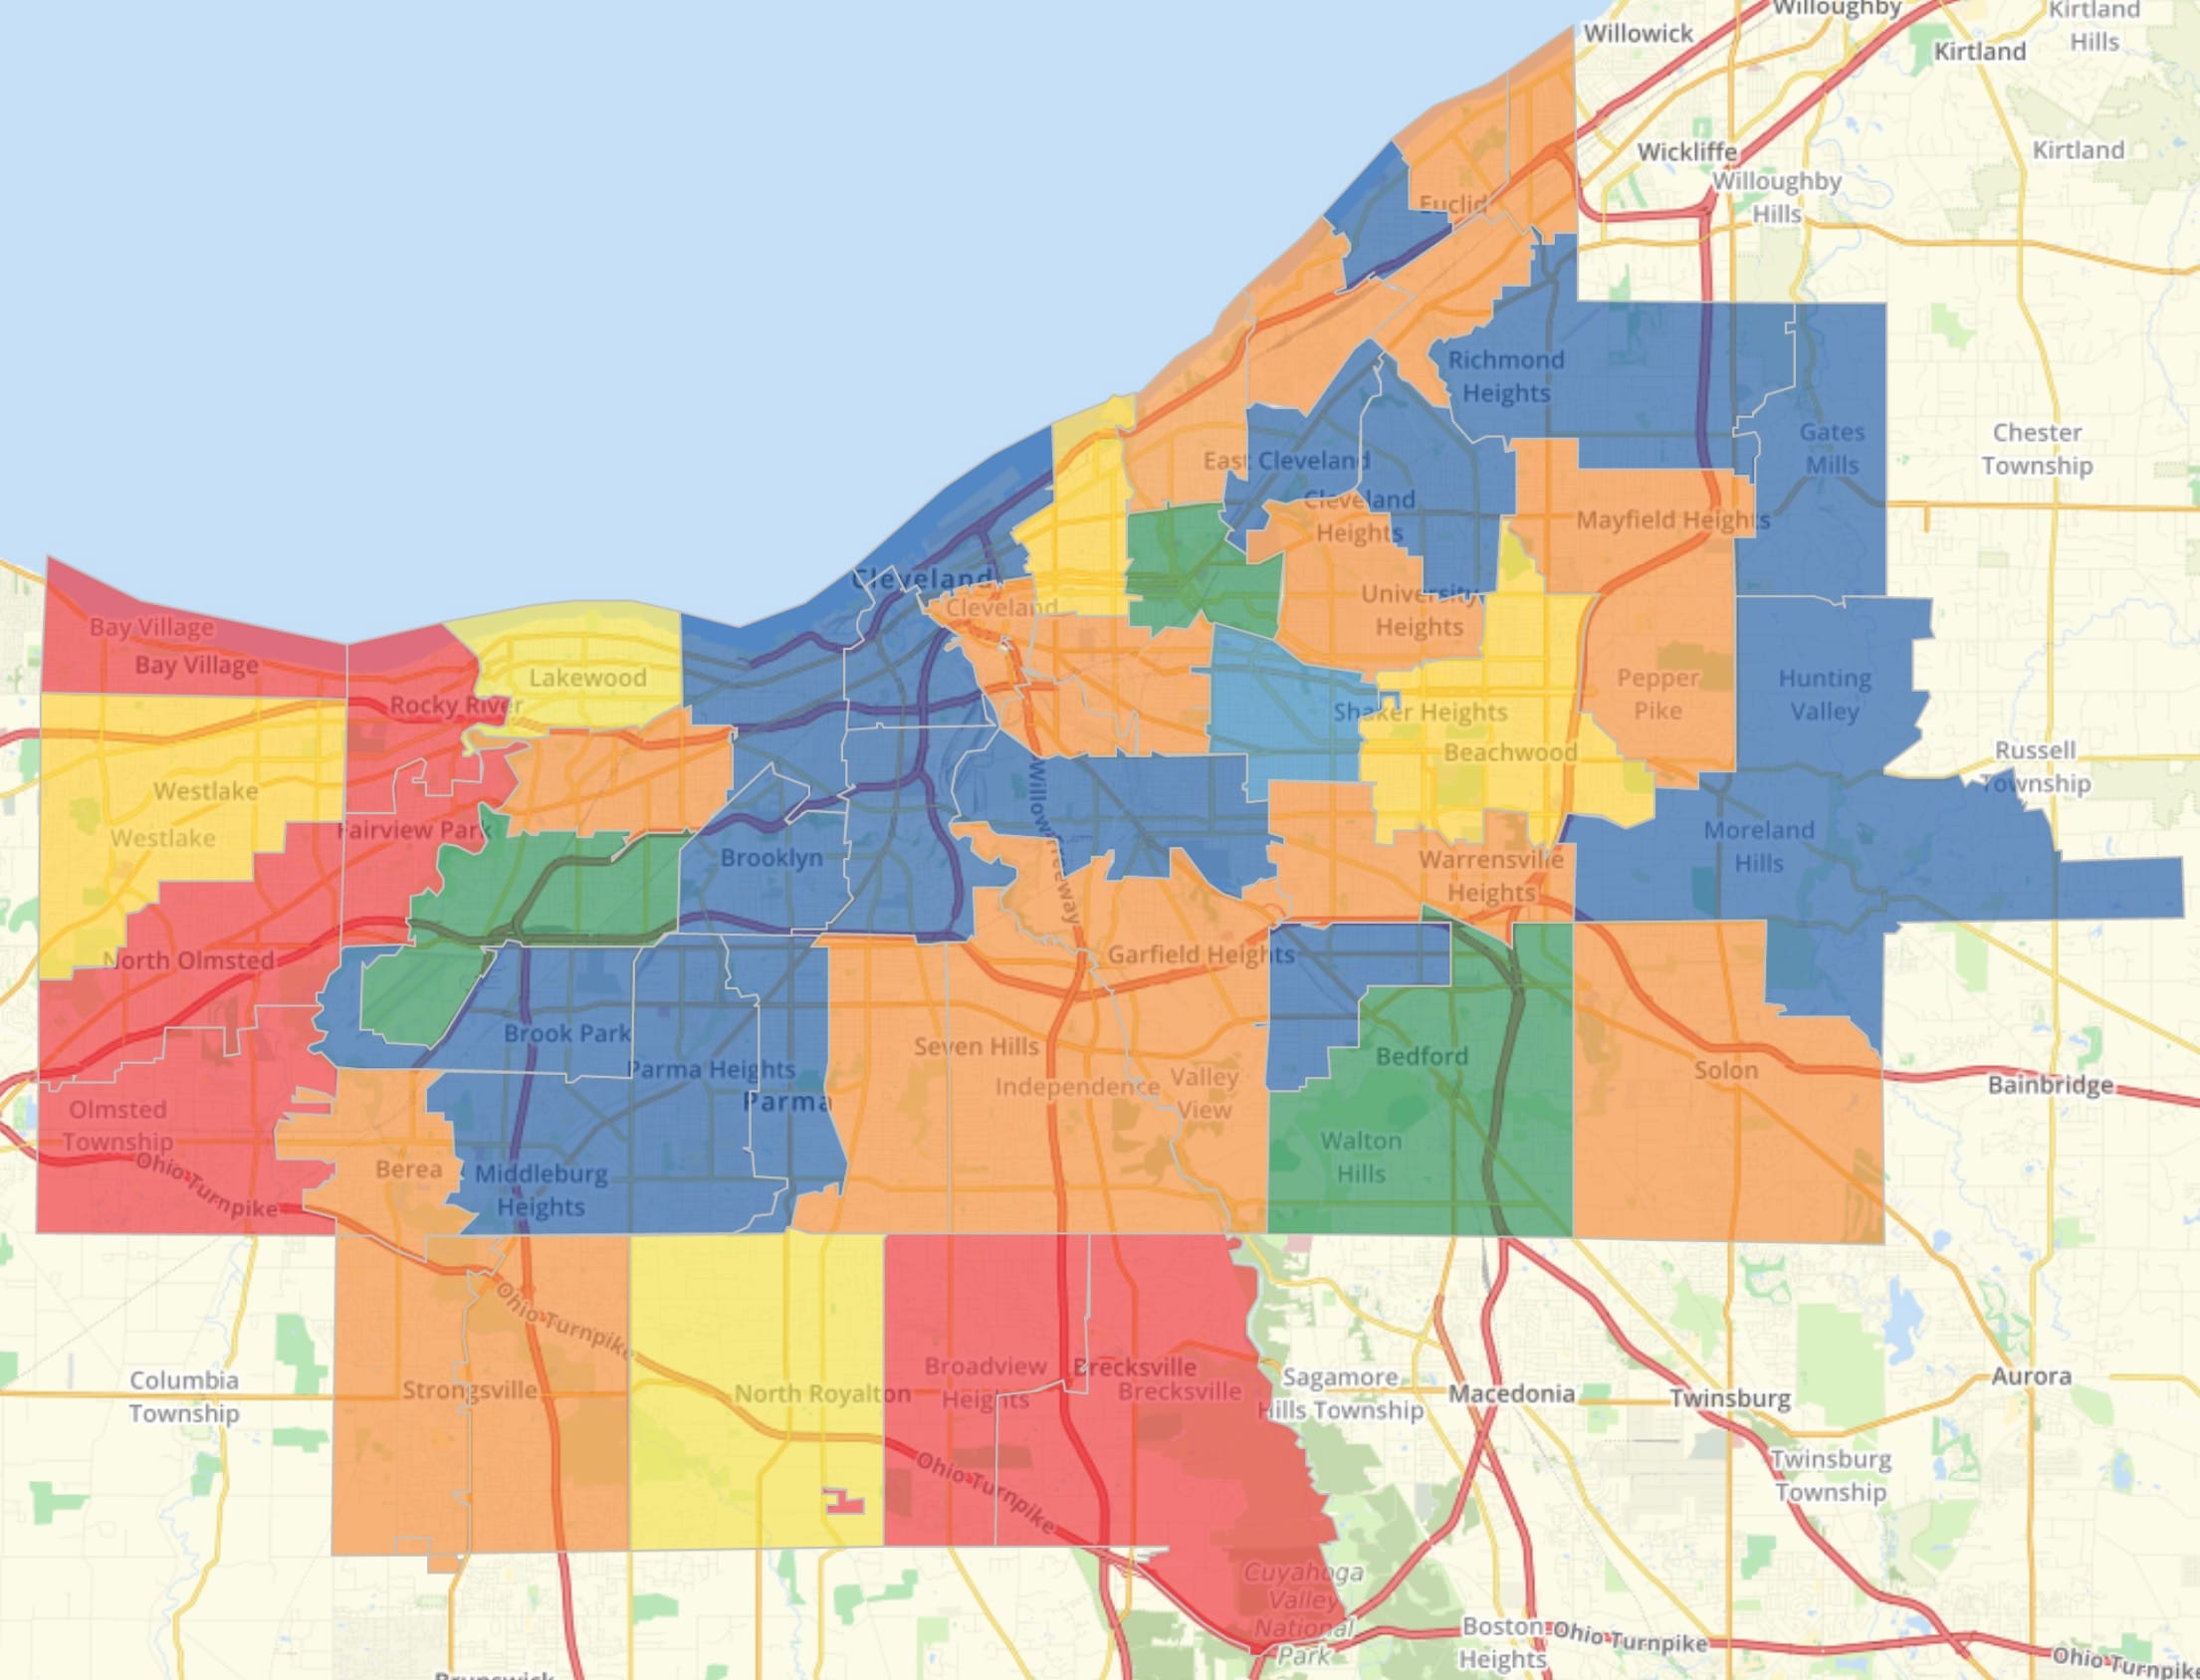
The applications of GIS are incredibly diverse, benefiting virtually everyone in Mohave County. A homeowner might use it to understand property lines, while a business owner could leverage demographic data for targeted marketing. County officials use GIS for infrastructure planning—optimizing the location of a new fire station, for example—while researchers analyze environmental trends. Explore the GIS Kershaw County portal and the interactive maps from GIS Pender County North Carolina for more examples of how GIS serves diverse needs.
GIS in Action: Real-World Applications
Imagine a wildfire threatening a residential area. Firefighters use real-time GIS mapping to track its progress, identify safe evacuation routes, and deploy resources strategically. Or consider managing the county’s extensive road network. GIS helps analyze traffic patterns, pinpoint areas needing repair, and plan for future expansions. Even park maintenance benefits from GIS, which allows tracking the location and condition of park assets for efficient scheduling.
The Future of GIS in Mohave County
The field of GIS is constantly evolving. Mohave County might see increased integration with other datasets, offering even richer insights. 3D modeling and virtual reality could provide immersive explorations of the county landscape. Ongoing research into AI and machine learning suggests these technologies may automate aspects of GIS analysis, leading to faster, more insightful results. While challenges like data accuracy and accessibility remain, the future of GIS in Mohave County is bright, promising powerful tools to understand and shape our environment.
What is GIS in the UK? A Comprehensive Guide
Geographic Information Systems (GIS) might sound complex, but they provide a powerful way to understand our world through location. Think of GIS as a digital detective, connecting where things are and why that matters. In the UK, this technology is transforming data into actionable insights for location-based decision-making across diverse sectors.
The Ordnance Survey: The Foundation of UK GIS
The UK boasts exceptionally detailed location data thanks to the Ordnance Survey (OS), the national mapping agency for Great Britain. They create and maintain a precise record of the country, providing the foundational data upon which much of UK GIS is built. This data, known for its accuracy and reliability, is essential for urban planning, environmental management, emergency response, and business analysis.
Practical Applications of GIS in the UK
GIS is used across various sectors in the UK:
- Urban Planning and Infrastructure: Optimizing land use, managing development projects, and improving city infrastructure.
- Environmental Management: Monitoring deforestation, tracking air quality, and modeling the impact of climate change.
- Business Intelligence: Conducting market analysis, selecting optimal sites for new businesses, and targeting customers effectively.
- Public Health: Tracking diseases, allocating healthcare resources, and managing epidemics.
- Emergency Services: Responding to disasters and deploying resources strategically.
| Sector | Application | Potential Benefits |
|---|---|---|
| Urban Planning | Optimizing land use | Sustainable development |
| Environmental Management | Monitoring deforestation | Protecting natural resources |
| Business | Market analysis | Increased profitability |
| Public Health | Disease tracking | Improved health outcomes |
| Emergency Services | Disaster response | Faster response times |
The Future of GIS in the UK
Emerging technologies like AI, Big Data, and cloud computing are transforming GIS in the UK. For example, AI could analyze satellite imagery to predict crop yields, assisting farmers in decision-making. Real-time GIS data could be used to manage autonomous vehicles, optimizing routes and minimizing congestion. While the full potential of GIS, especially in conjunction with AI and Big Data, is still being explored, research suggests it will play a significant role in how we understand and interact with our world. There is ongoing discussion on leveraging these technologies while balancing innovation with ethical considerations.
What is GIS in Google Maps?
Google Maps is more than just blue dots and turn-by-turn directions. GIS is the engine under the hood, powering many of its features.
GIS: Google Maps’ Secret Weapon
GIS is the invisible framework that captures, stores, analyzes, and displays the location-based information that makes Google Maps so powerful. It’s the reason Google Maps knows where you are, can route you around traffic, and can even show you the terrain of a mountain range.
Beyond Navigation: The Power of GIS in Google Maps
GIS in Google Maps goes beyond simple directions. Geocoding allows you to find a location by its coordinates. Routing algorithms use GIS data to find the best path, considering distance, traffic, and road closures. Even terrain visualization relies on GIS components.
Google Maps vs. Professional GIS Software: Pocketknife vs. Toolkit
Google Maps offers convenient, everyday GIS functionality. However, professional GIS software like ArcGIS provides advanced analytical capabilities and customization for experts to manipulate and analyze spatial data, creating detailed maps and building sophisticated geospatial models.
Real-World Impact of GIS in Google Maps
GIS in Google Maps has a broad impact: health organizations track disease outbreaks, environmental researchers monitor deforestation, and urban planners visualize proposed developments. In Mohave County, residents and officials can utilize these features for local projects, integrating the county’s specific GIS resources with Google Maps for powerful localized solutions. Some experts suggest that integrating platforms like Google Maps with dedicated GIS resources will play a vital role in the future of local governance.
| Feature | GIS Enhancement | Mohave County Example |
|---|---|---|
| Navigation | Routing algorithms, real-time traffic | Finding the best route to an event |
| Location Search | Geocoding, address matching | Locating a business in Kingman |
| Visualization | Terrain rendering, data overlays | Mapping flood-prone areas |
| Data Analysis | Demographic overlays, heatmaps | Analyzing population growth trends |
The Mapping Process in GIS: A Step-by-Step Guide
Creating a map with GIS is like a culinary adventure, transforming raw data into a dish of knowledge.
I. Data Acquisition: Sourcing the Ingredients
Just like a chef needs fresh ingredients, GIS analysts require reliable data. This data can come from various sources:
- Mohave County GIS Portal: Offers local information like property boundaries and aerial photos (https://www.mohave.gov/departments/…, https://az-mohave.opendata.arcgis.com). Data is often available in formats like CSV, KML, Zip, GeoJSON, GeoTIFF, and PNG.
- OS MasterMap (UK): Provides detailed land information crucial for development and site analysis (https://www.ukmapcentre.com), often in DXF or DWG format.
- RepRisk Geospatial: Integrates ESG and business conduct risk data with geospatial information for comprehensive risk assessments (https://www.reprisk.com).
Data acquisition also involves methods like GPS, surveying, and remote sensing (aerial photography, satellite imagery).
II. Geoprocessing: Preparing the Data
Raw data needs preparation before it can be used in GIS software. This includes cleaning, transforming, and formatting data, addressing coordinate systems and projections. Geoprocessing involves advanced techniques like buffering (creating zones around features) and overlay analysis (combining data layers).
III. Visualization and Cartography: Plating the Map
This stage involves creating the visual representation of the data. Cartography, the art of mapmaking, guides the selection of colors, symbols, and labels. Different map types, like thematic maps (highlighting specific themes) and topographic maps (showing elevation), cater to different purposes.
IV. Interpretation and Analysis: Digesting the Insights
Analyzing spatial patterns and relationships reveals hidden stories and trends. This stage turns data into actionable knowledge. For instance, overlaying crime data with demographics can identify areas needing increased police presence.
V. Sharing and Collaboration: Sharing the Recipe
The final stage involves distributing the map to a wider audience through various formats (PDFs, image files, GIS data formats) or using online platforms like ArcGIS Online. This fosters collaboration and informed decision-making.
- HelpCare Plus: Revolutionizing Affordable and Accessible Healthcare - December 29, 2024
- Boom & Bucket: Your Digital Marketplace for Used Heavy Equipment - December 28, 2024
- Ankle Bones Crossword Clue: Solutions, Tips & Anatomical Insights - December 28, 2024






2 thoughts on “GIS: Unlocking Mohave County’s Potential with Maps and Data”
Comments are closed.