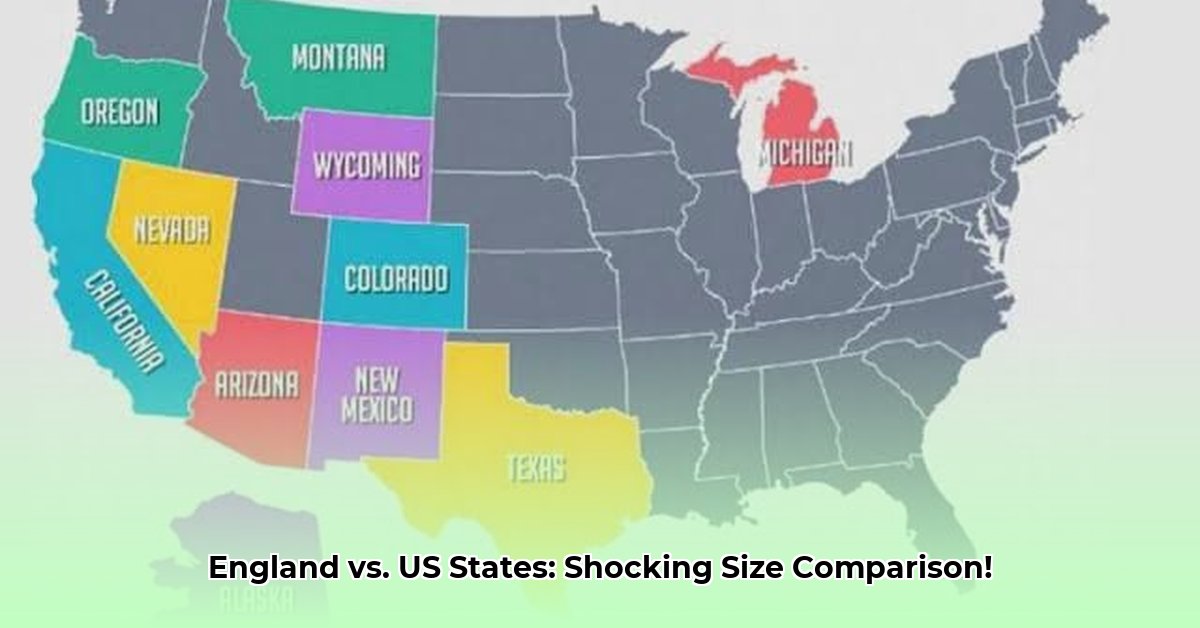
The United States, a land of sprawling landscapes and diverse climates, is undeniably vast. But how does England’s size truly compare to individual US states? This exploration delves beyond simple land area comparisons to uncover surprising parallels and crucial differences, considering population density, economic structures, and historical context. Is Alabama truly England’s twin, or are there deeper disparities hidden beneath the surface? What lessons can we glean from comparing Oregon to the entire United Kingdom? By examining these comparisons, we gain a deeper understanding of how geography, history, and demographics shape a region’s identity. For a visual comparison, check out this US map.
Alabama vs. England: Size Isn’t Everything
Alabama and England share a remarkably similar land area of roughly 50,000 square miles. However, this apparent equivalence masks significant differences. While their footprints on the map might appear similar, their demographics and development tell distinct stories. England’s population density dwarfs Alabama’s, resulting in bustling cities and interconnected towns, a stark contrast to Alabama’s more dispersed, rural landscape. This divergence isn’t simply about numbers; it reflects distinct historical trajectories, economic realities, and cultural nuances. England’s industrial revolution and its role as a global hub fostered dense urban centers, while Alabama’s agrarian history and later industrial development led to a more spread-out population. Understanding these divergent paths reveals the complex interplay of history, economics, and geography in shaping regional development.
Oregon vs. the UK: A Coastal Conundrum
Scaling up the comparison, Oregon’s area roughly matches the entire United Kingdom, encompassing approximately 95,000 square miles. Both regions boast stunning coastlines, drawing tourists and fueling economic activity related to fishing, tourism, and shipping. However, the similarities largely end there. The UK, a historical epicenter of global trade and finance, possesses a vastly more complex and interconnected economy than Oregon. While Oregon’s economy thrives on industries like agriculture, timber, and technology, it lacks the global reach and intricate layering of the UK’s financial markets, international trade networks, and diverse manufacturing sectors. This disparity underscores the profound influence of historical events and global interconnectedness on regional development, even when land areas are comparable. The UK’s historical role as a global power, its colonial past, and its continued influence on international affairs have shaped its economy in ways that Oregon’s relatively recent development cannot mirror.
Beyond Size: Unpacking the Nuances
Direct size comparisons are complicated by differing data collection methods and, more importantly, vastly different historical contexts. England’s long history as a global power significantly shaped its infrastructure, economic development, and cultural landscape, creating a distinct developmental trajectory from Oregon’s. These differences highlight a crucial insight: simply comparing size doesn’t tell the whole story. Factors like population density, economic diversification, historical events, and cultural influences profoundly influence a region’s trajectory. To truly understand the complexities of regional comparisons, we must move beyond simple metrics and delve into the rich tapestry of historical, economic, and cultural factors that shape each region’s unique identity.
Comparing US and UK Population Density: A Methodological Approach
Effectively comparing population densities between US states and UK counties requires a nuanced approach that considers the significant differences in size, administrative boundaries, and data collection methods. This section outlines a structured methodology emphasizing data normalization, geographical alignment, and contextual interpretation. By employing a rigorous and thoughtful approach, we can uncover hidden connections and gain valuable insights into population distributions across the Atlantic.
Beyond Raw Numbers: The Power of Density
Raw population figures can be misleading when comparing regions of vastly different sizes. California’s large population, for instance, is dispersed across a vast area, resulting in a lower population density than smaller, more densely populated states like New Jersey. Comparing population density—people per square mile or kilometer—provides a more accurate reflection of urban pressures, resource allocation, and living conditions. This crucial metric allows us to analyze population distribution more effectively, revealing patterns of urbanization, suburban sprawl, and rural settlement.
Navigating Methodological Differences
Comparing US and UK population data requires careful consideration of differing methodologies. The US Census Bureau and the UK’s Office for National Statistics employ distinct approaches to data collection and geographical divisions. The US uses states and counties, while the UK uses counties, districts, and unitary authorities. Understanding these differences is crucial for accurate comparisons. To ensure meaningful analysis, we must reconcile these variations through careful data normalization and a focus on comparable geographical units. For example, comparing a US state to a similarly sized grouping of UK counties might provide a more accurate comparison than comparing a state to a single UK county.
A Step-by-Step Guide for Effective Comparison
Data Acquisition: Gather data from reputable sources, such as the US Census Bureau (census.gov) and the Office for National Statistics (ons.gov.uk). Ensure the data is current and relevant to the specific comparison being made.
Data Normalization: Convert data to a common unit (e.g., people per square kilometer) to ensure comparability. This allows for direct comparisons between regions using a standardized metric.
Geographical Alignment: Compare regions of similar scale and characteristics. Consider factors such as urban/rural classifications, economic activity, and geographical features when selecting comparable regions. For instance, comparing a predominantly rural US state to a similarly rural area in the UK will provide more meaningful insights than comparing a rural US state to a major metropolitan area in the UK.
Data Visualization: Use maps, charts, and other visual aids to reveal patterns and trends in population density. Visualizations can help to highlight areas of high and low density, as well as variations within and between regions.
Contextualization: Crucially, consider historical, economic, and geographical factors to understand the observed patterns. Contextualization provides a deeper understanding of why population densities vary across regions and how these variations relate to broader social, economic, and historical trends.
Sustainable Urban Planning: US vs. England
Sustainable urban planning models in high-density US cities and their English counterparts face the common challenge of balancing density with affordability, equity, and quality of life. This section explores these challenges, considering the impact of technology on urban design and drawing lessons from transatlantic comparisons to uncover best practices for creating sustainable and thriving urban environments.
Density’s Double-Edged Sword
High-density living, while environmentally advantageous in terms of reduced carbon footprints and efficient resource use, presents significant challenges. It can exacerbate affordability issues, strain infrastructure, and create social inequalities if not managed carefully. Ensuring equitable access to green spaces, essential services, and affordable housing in dense urban areas requires careful planning, innovative solutions, and a commitment to social equity.
Transatlantic Case Studies: New York City vs. London
Comparing New York City and London reveals valuable insights into different approaches to high-density living. Both cities grapple with similar challenges, but their approaches differ due to historical context, urban development patterns, and cultural influences. London’s centuries-old urban fabric, characterized by narrow streets and mixed-use development, contrasts with New York’s more recent, often car-centric grid system. These differences highlight the importance of context-specific solutions. There’s no one-size-fits-all approach to sustainable urban planning; strategies must be tailored to each city’s unique history, geography, and social fabric.
Technology’s Transformative Impact
Technological advancements are reshaping urban planning in profound ways. Improved transportation systems, smart city technologies, and the rise of remote work are challenging traditional notions of high-density living. Decentralized, lower-density urban forms, once considered unsustainable, may become more viable thanks to technology. These advancements offer exciting new possibilities for urban design, allowing for more flexible and adaptable urban spaces that can better meet the evolving needs of residents.
A Nuanced Approach to Sustainability
Effective sustainable urban planning requires a holistic, nuanced approach that goes beyond simply increasing density. It’s about balancing density with affordability, equity, and quality of life, ensuring that urban environments are not only environmentally sustainable but also socially just and economically vibrant. This requires integrating data-driven insights, community engagement, and a deep understanding of local needs to create urban spaces that are both sustainable and livable for all residents.
Hello, My love for writing is rivaled only by my passion for in-depth research. While many may skim the surface, I dive deep, seeking the hidden gems of information that give a story texture and depth. Every word I write is backed by hours of exploration, ensuring that my work is not just compelling, but also meticulously accurate. Join me on a journey where every piece is a deep dive into the realms of knowledge and storytelling.