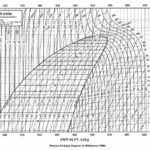
Keeping your R410A air conditioner running smoothly means getting the pressure just right. This guide breaks down everything you need to know about R410A pressure, whether you’re an HVAC professional or a homeowner. We’ll explore using a pressure-temperature (PT) chart, troubleshooting common issues, and understanding expected pressures at various temperatures. Let’s get started!
Decoding R410A Pressure
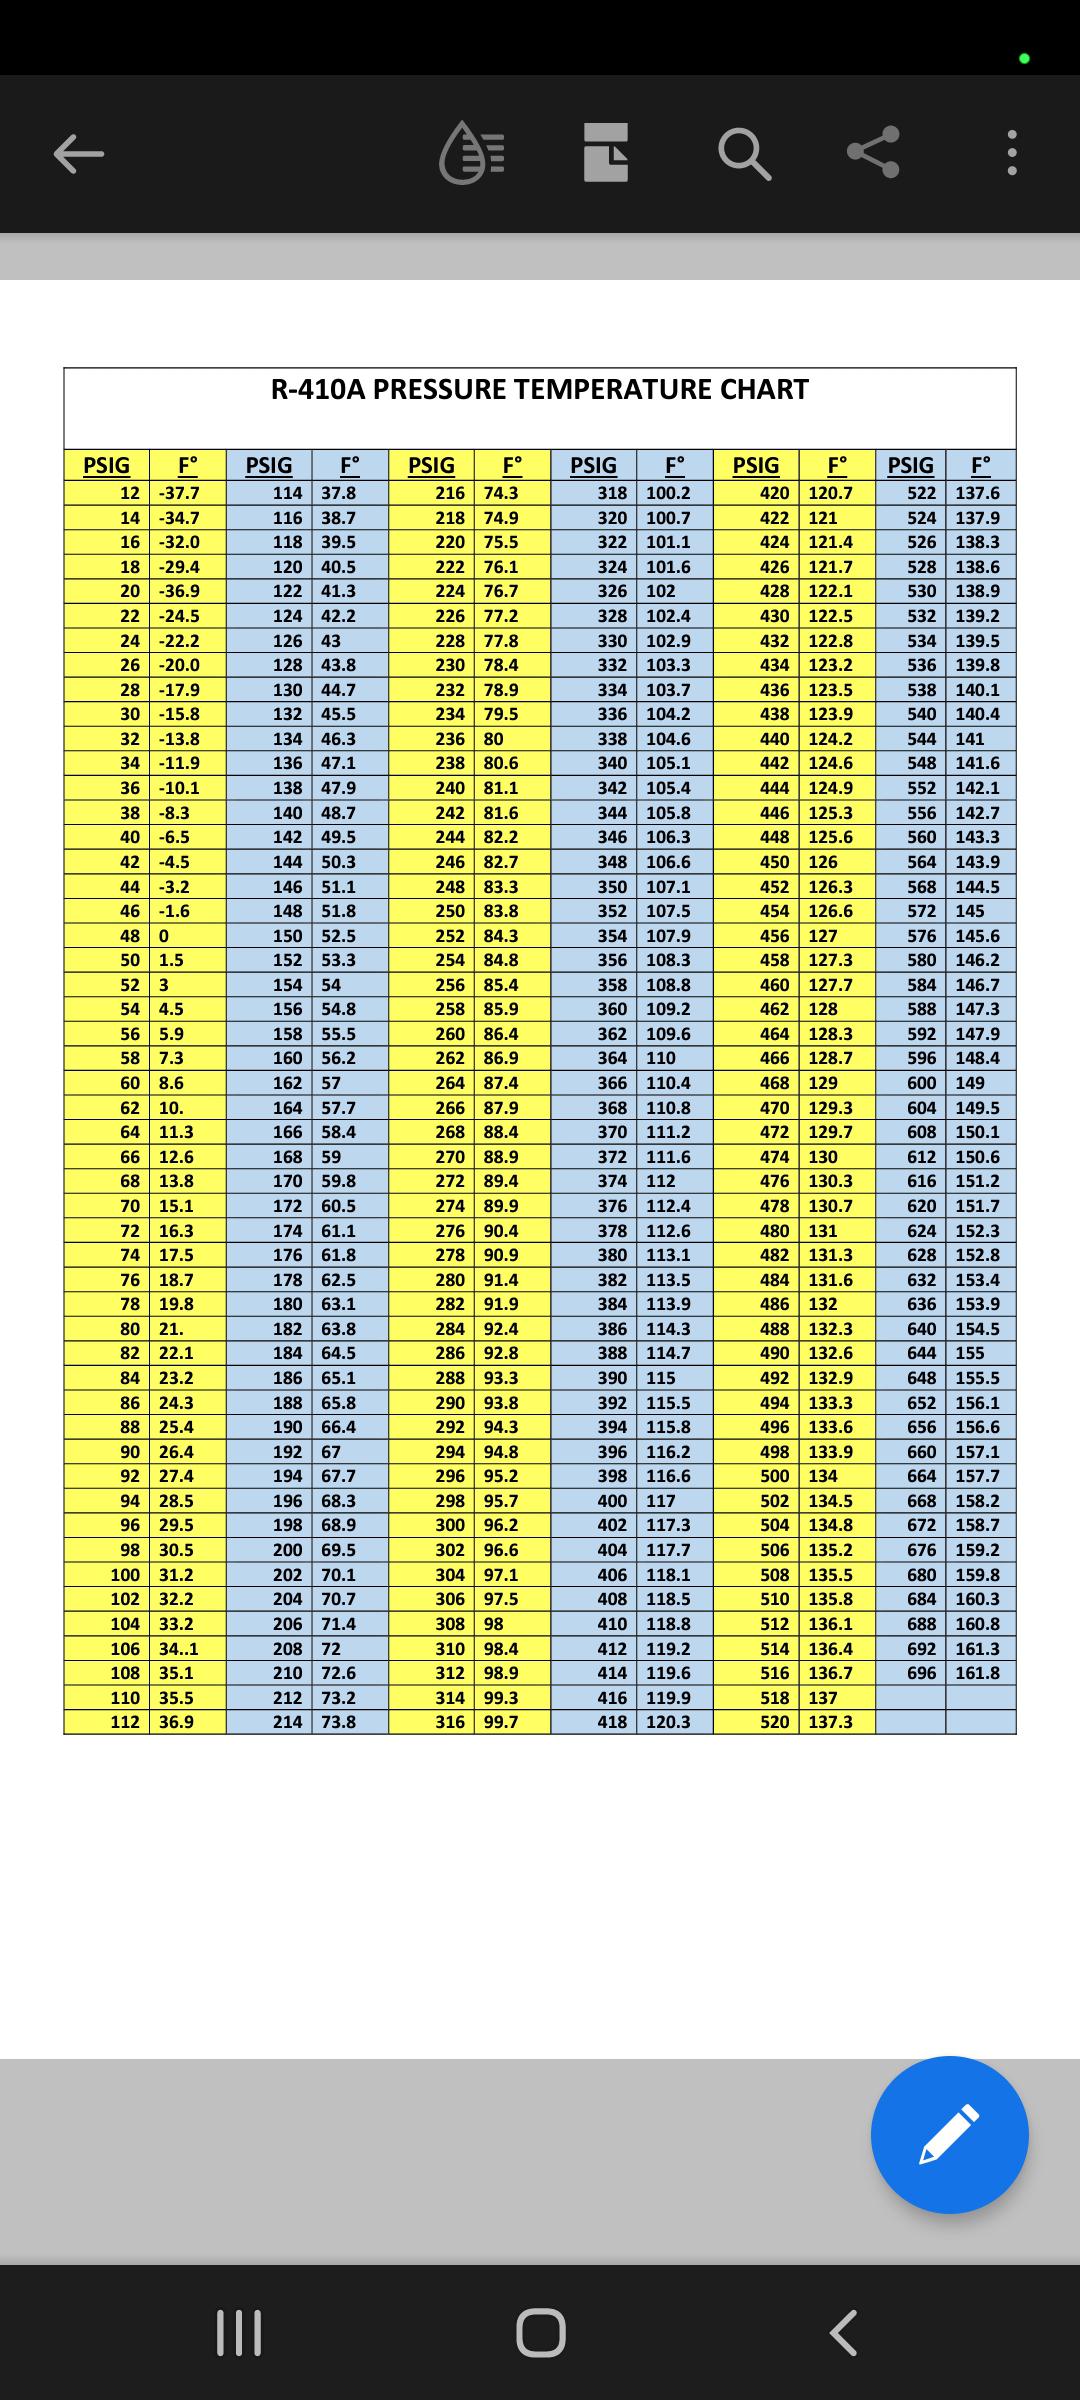
Understanding R410a refrigerant pressure is vital for your AC system’s health. R410a, commonly used in air conditioners and heat pumps, operates on a delicate pressure-temperature balance. As temperature rises, so does pressure. This relationship is crucial for efficiency and preventing breakdowns. The key to understanding this relationship is the R410a PT chart [https://www.lolaapp.com/r410a-pt-chart/], your system’s decoder ring.
Why is the R410a PT Chart Important?
The R410a PT chart [https://www.lolaapp.com/r410a-pt-chart/] is a practical tool that helps you:
- Diagnose Problems: Quickly pinpoint malfunctions with a pressure reading and the chart.
- Prevent Damage: Avoid stressing system components by understanding the correct pressure-temperature relationship.
- Optimize Performance: Ensure peak efficiency for energy savings and comfort.
Using the R410a PT Chart: A Step-by-Step Guide
Using the R410a PT chart [https://www.lolaapp.com/r410a-pt-chart/] is straightforward:
- Measure Ambient Temperature: Use a thermometer to measure the outdoor air temperature.
- Find Temperature on Chart: Locate this temperature on the chart’s horizontal axis.
- Determine Expected Pressures: Trace a vertical line from the temperature until it intersects the pressure curves. The intersection points represent the expected liquid line (high side) and vapor line (low side) pressures.
- Compare with System Pressures: Measure the actual high-side and low-side pressures using gauges. Compare these readings with the chart values. A significant difference suggests a potential problem.
Common R410A Pressure-Related Problems
HVAC systems can experience issues. Here’s how the R410a PT chart [https://www.lolaapp.com/r410a-pt-chart/] helps diagnose them:
- Low Suction Pressure: Often suggests a refrigerant leak, similar to a slow tire puncture. Other possibilities include a system restriction or a malfunctioning metering device.
- High Head Pressure: May indicate a blockage, restricted airflow, or an overcharge of refrigerant, much like a clogged artery. Possible causes include a dirty condenser coil, a faulty fan motor, or excess refrigerant.
- Correct Pressures, No Cooling: This probably suggests an issue beyond pressure-temperature correlation, such as a malfunctioning compressor, expansion valve, or electrical controls.
Example: A 95°F Day
On a 95°F day, the R410a PT chart [https://www.lolaapp.com/r410a-pt-chart/] might indicate expected pressures around 295 psi (high side) and 118 psi (low side). Readings significantly different from these warrant further investigation.
The Importance of Precision
Accurate use of the R410a PT chart [https://www.lolaapp.com/r410a-pt-chart/] is crucial. Misinterpretation can lead to:
- Inefficient Cooling: The system won’t cool effectively.
- Higher Energy Bills: The system will work harder, consuming more energy.
- Premature Component Failure: Incorrect pressures can stress components.
- Safety Hazards: Refrigerant leaks pose health and environmental risks.
Determining Ideal R410A Pressures
There’s no single “perfect” R410A pressure. The ideal pressure depends on the temperature. As temperature increases, so does pressure, and vice versa. This relationship is crucial for understanding R410A systems. A Pressure-Temperature (P-T) chart, like the r410a pt chart [https://www.lolaapp.com/r410a-pt-chart/], is essential for determining the expected pressure at a given temperature. While ambient temperature is the primary factor, superheat, subcooling, and system load also influence pressure.
Comparing actual pressure readings to the P-T chart helps diagnose problems. A lower-than-expected pressure may suggest a leak, while a higher-than-expected pressure might indicate a blockage or overcharge. Working with R410A requires safety precautions due to high pressures. Always wear appropriate safety gear and ensure proper ventilation. Ongoing research continues to explore refrigerant behavior, and future findings may further refine our understanding of ideal pressures.
R410A Cylinder Pressure
The pressure in an R410A cylinder fluctuates with temperature. On a hot day, the pressure inside a cylinder will be higher than on a cold day. A PT chart helps determine the expected cylinder pressure at a given temperature. While cylinder pressure varies, system operating pressures should remain within a specific range (typically 280-450 PSI high side and 80-150 PSI low side for R410A). When charging a system, R410A should be charged as a liquid with the cylinder inverted to ensure the correct refrigerant blend. Troubleshooting pressure issues involves comparing actual readings with the PT chart and considering various factors. If unsure, consult a qualified HVAC technician.
R410A Pressure at 65°F
At 65°F (18.3°C), the saturation pressure of R410A is approximately 185 psig. This is a reference point, and actual pressure can vary due to several factors. A PT chart provides accurate pressure readings for different temperatures. Knowing the pressure at 65°F is important for charging AC systems. Superheat and subcooling are also essential metrics for evaluating system performance. Low suction pressure can suggest a leak, while high head pressure might indicate a blockage or overcharge. Alongside pressure readings, consider other factors like outdoor temperature and system load for effective troubleshooting. Ongoing research continues to refine our understanding of refrigerants and their behavior.
The Future of Refrigerants
While R410A is currently prevalent, the HVAC industry is shifting towards more environmentally friendly refrigerants. These new refrigerants will have unique pressure-temperature relationships and corresponding charts. Staying updated on these changes is vital for HVAC professionals. For a deeper dive into R410A’s pressure-temperature dynamics, explore our detailed R410a pt chart [https://www.lolaapp.com/r410a-pt-chart/]. This resource provides valuable insights for understanding and troubleshooting R410A systems.
- Crypto Quotes’ Red Flags: Avoid Costly Mistakes - June 30, 2025
- Unlock Inspirational Crypto Quotes: Future Predictions - June 30, 2025
- Famous Bitcoin Quotes: A Deep Dive into Crypto’s History - June 30, 2025
