Decoding Your AC System with the R410A PT Chart
Dealing with R410A refrigerant? Then an R410A Pressure-Temperature (PT) chart is essential. This guide breaks down everything you need to know – from what the chart is to how to use it for troubleshooting and system optimization in the field. Dive into the intricacies of refrigerant behavior with this insightful pressure chart R410a. Whether you’re a seasoned HVAC pro or just starting out, this guide will make the R410A PT chart a valuable tool in your arsenal.
What is an R410A PT Chart?
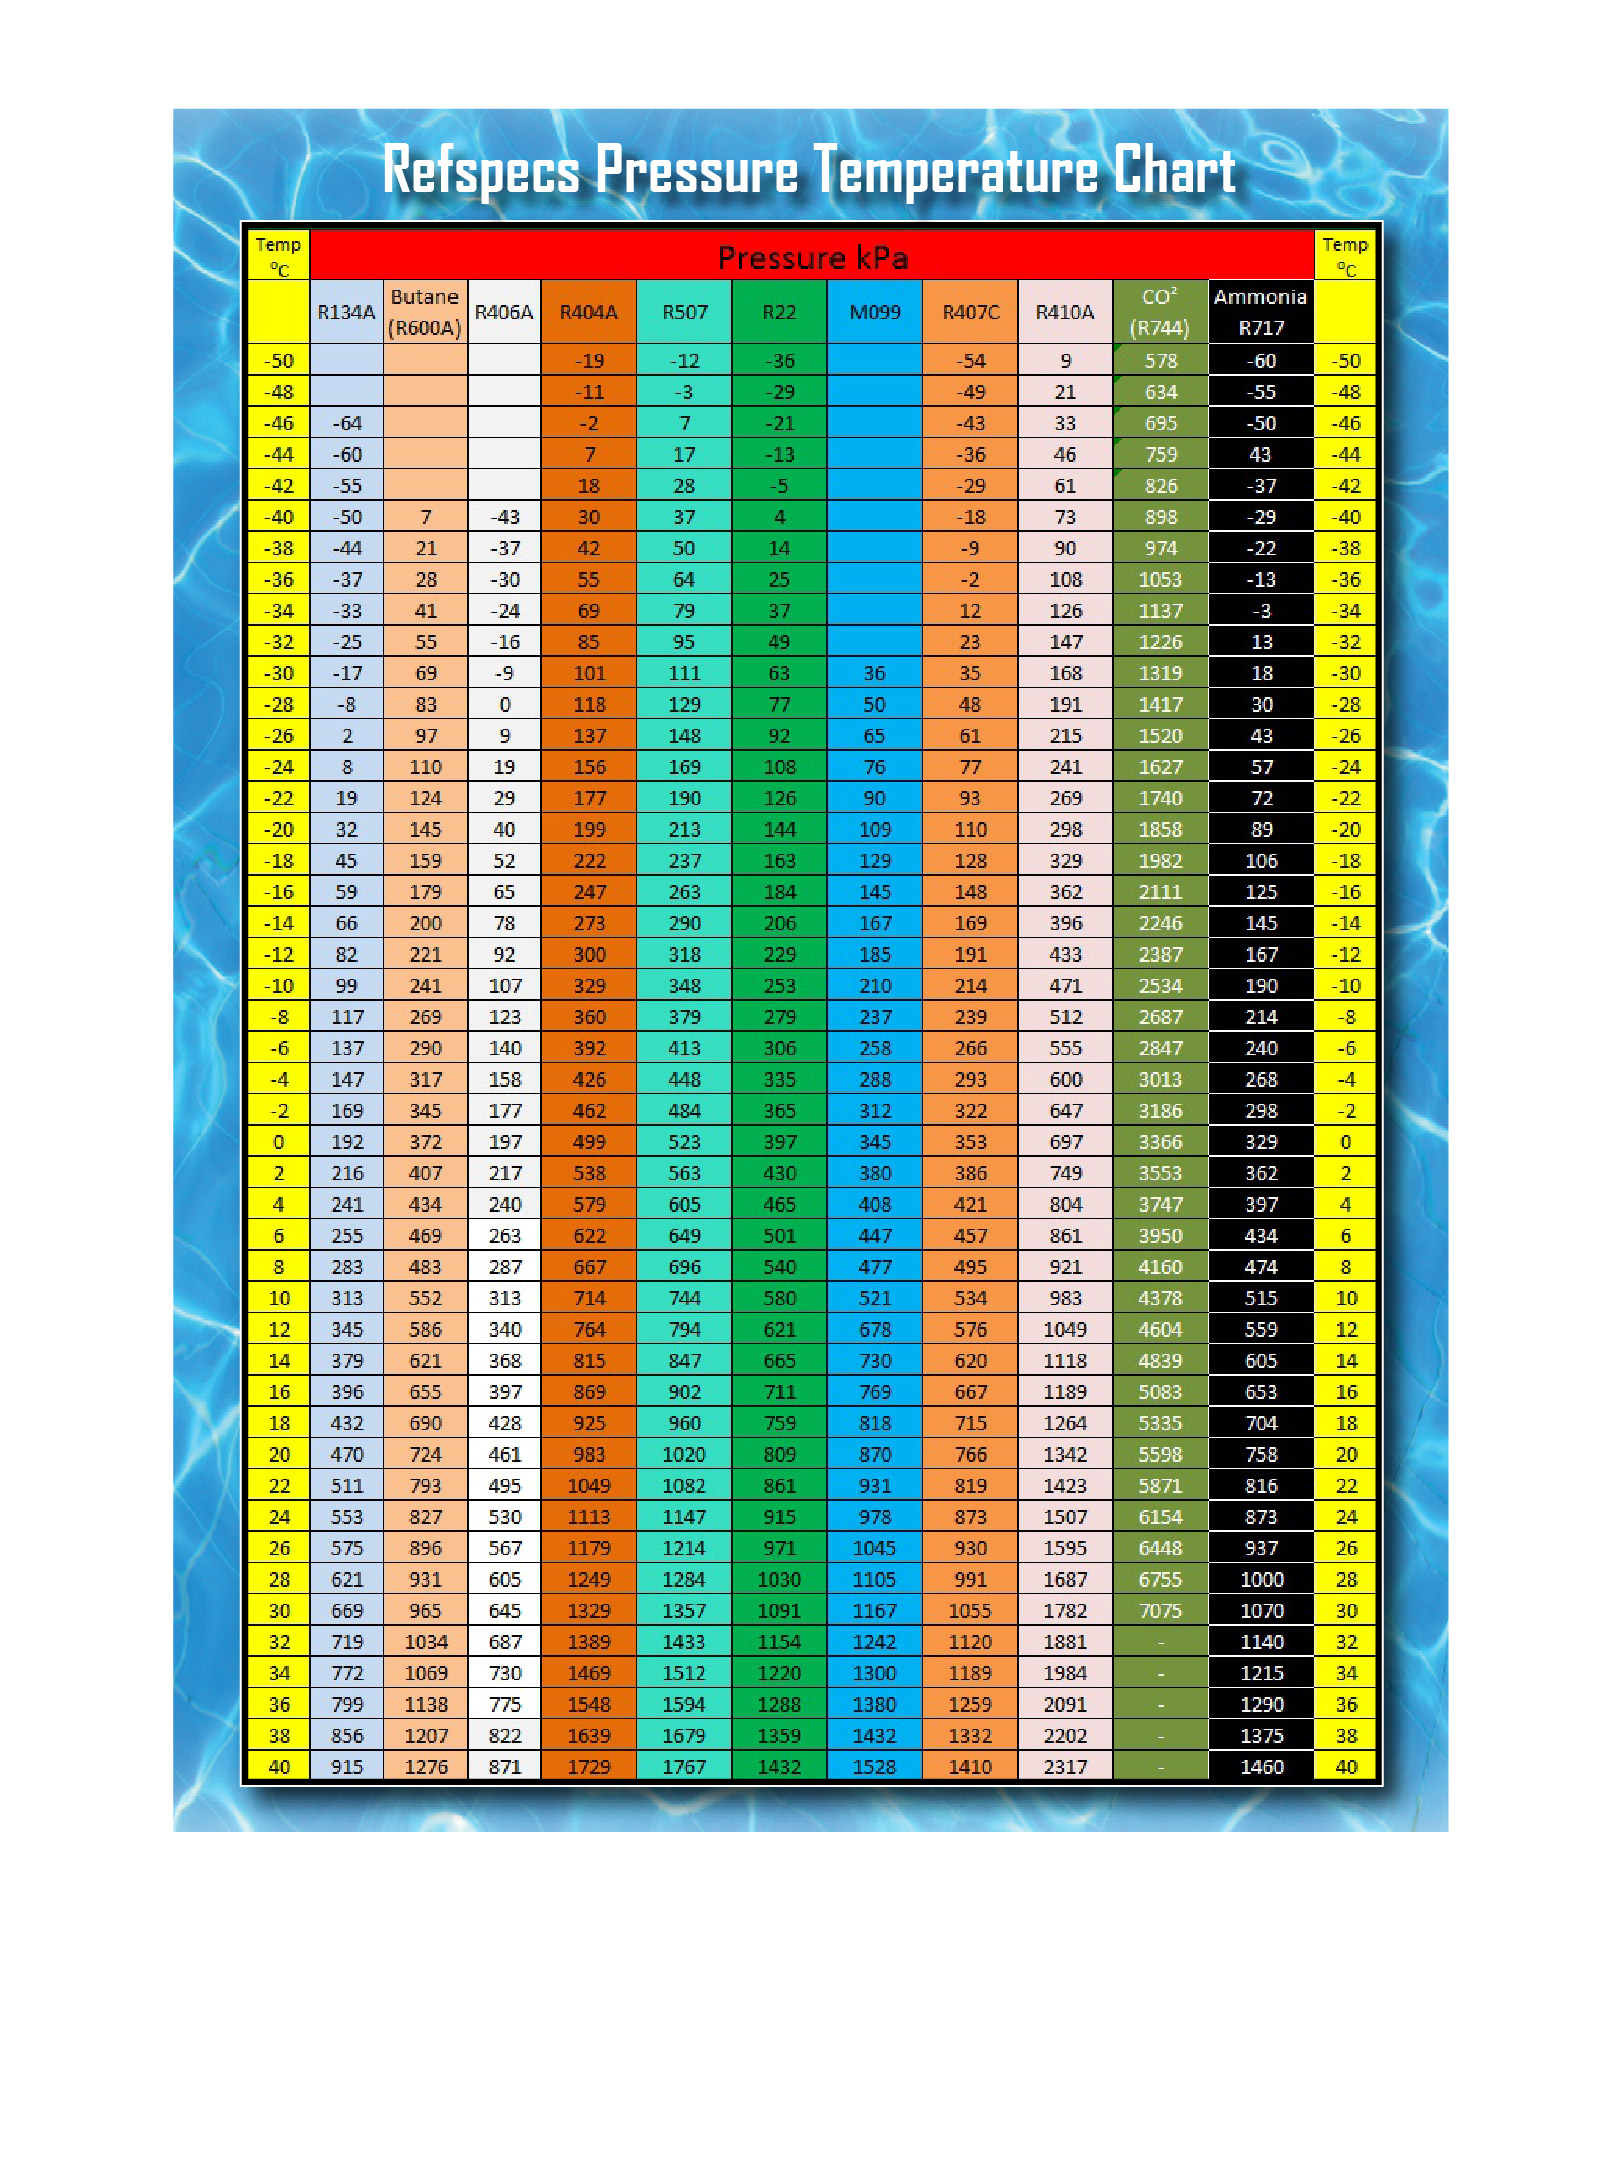
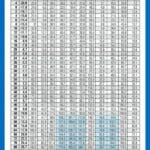
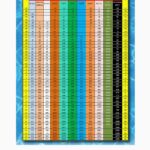
An R410A PT chart is a graphical representation of the relationship between pressure and temperature for R410A refrigerant when it’s in a saturated state (meaning both liquid and vapor exist). Think of it as a roadmap for your refrigerant, showing you how pressure and temperature interact. Why is this important? Because these two factors are vital signs for your AC system, much like a pulse and blood pressure for the human body. This information is crucial for diagnostics and ensuring optimal system health.
Reading the R410A PT Chart: A Step-by-Step Guide
-
Check Your Units: Ensure your chart’s units (psig/bar for pressure and °F/°C for temperature) match your gauges and thermometer.
-
Measure the Temperature: Using a reliable thermometer, measure the refrigerant line temperature. The exact location depends on the diagnostic procedure.
-
Locate the Pressure: Find the measured temperature on the chart’s horizontal (temperature) axis. Trace a line vertically until it intersects the R410A saturation curve.
-
Interpret the Intersection: The point where your temperature line meets the curve represents the expected pressure for that temperature. Compare this to your actual system pressure reading using a pressure gauge. Any significant difference indicates a potential problem.
Real-World Applications: Using the PT Chart for Diagnostics
The PT chart can help pinpoint a range of issues:
-
Low Refrigerant Charge: If your system pressure is lower than what the chart indicates for the measured temperature, it probably suggests an undercharge, possibly due to a refrigerant leak.
-
Overcharged System: Conversely, a pressure higher than the expected value may indicate an overcharged system.
-
Other Potential Issues: The PT chart also helps identify more complex issues like restricted airflow (dirty filters) or compressor problems. Discrepancies between pressure and temperature can be telltale signs.
Superheat and Subcooling: Fine-Tuning Your Diagnosis
For a more granular analysis, the PT chart allows you to calculate superheat and subcooling:
-
Superheat: The temperature difference between the refrigerant vapor and its saturation temperature at a given pressure. It tells you how much the vapor has warmed above its boiling point.
-
Subcooling: The temperature difference between the liquid refrigerant and its saturation temperature at a given pressure. It indicates how much the liquid has cooled below its condensation point.
These values offer valuable insights into system performance and can predict potential issues before they escalate.
Chart Variations and Accessibility
R410A PT charts come in different formats, using either metric or imperial units. Just make sure your chart matches your measuring tools. You can readily find R410A PT charts online (from HVAC manufacturers, refrigerant suppliers, even mobile apps).
Safety First!
Always adhere to safety protocols when handling refrigerants, which are under high pressure. The PT chart is a powerful tool, but never a substitute for safe practices.
The Future of Refrigerants
While R410A is currently prevalent, the HVAC industry is constantly evolving. Research into more environmentally friendly refrigerants is ongoing. Keep up-to-date on the latest advancements and regulations.
What Should My 410A Pressures Be?
As discussed, R-410A pressures are temperature-dependent. On a moderately warm day, high-side (discharge) pressure typically falls between 280-450 PSI, while low-side (suction) pressure tends to be around 80-150 PSI. However, ambient temperature deeply influences these readings. The PT chart is essential for precision – at 75°F ambient temperature, the suction pressure is likely around 120 psi, and the discharge pressure probably less than 600 psi.
Troubleshooting with Pressure Readings
The PT chart is crucial for diagnosis. For instance, low suction pressure may suggest a leak, while high discharge pressure could indicate a dirty condenser coil or overcharging. More precise diagnosis incorporates superheat (target: 8-12°F) and subcooling (target: 10-15°F), revealing how effectively the refrigerant absorbs and releases heat. For more detailed information about navigating those readings, explore our R-410A pressure troubleshooting guide.
Maintaining Proper Pressures: Efficiency and Longevity
Maintaining correct pressures isn’t just about functionality; it’s about system efficiency, preventing damage, and extending equipment lifespan. Charging the system correctly is paramount, as it directly impacts pressure balance. Improper charging (not charging as liquid, for instance) can dramatically affect performance.
Safety and Future Considerations
Ongoing research explores R-410A’s behavior under various conditions, potentially leading to refined understanding and PT chart application. While R-410A is widespread, the industry is shifting towards eco-friendly refrigerants with reduced environmental impact. Always prioritize safety when handling refrigerants and consult a qualified technician when needed.
How to Use a 410A PT Chart
The R410A PT chart helps decipher the relationship between pressure and temperature for R410A refrigerant, especially when it’s in a saturated state, which is crucial for properly functioning HVAC systems. This understanding helps identify deviations indicative of underlying issues. Curious about how to apply this chart in your own system maintenance? We have a guide on how to use a 410a pt chart that walks you through the steps.
A Step-by-Step Approach
-
Match Units: Ensure your chart’s units align with your measurement tools.
-
Measure Temperature: Accurately measure the refrigerant line temperature.
-
Find Corresponding Pressure: On the chart, locate the measured temperature and trace a horizontal line to the pressure curve, revealing the expected saturation pressure.
-
Compare and Interpret: Compare this expected pressure with the actual system pressure. Any significant difference suggests a potential problem, like overcharging, undercharging, air in the system, or other malfunctions.
Practical Examples and Applications
-
Overcharging Suspicion: If your actual pressure reading significantly exceeds the expected pressure from the chart, it may suggest an overcharged system.
-
Potential Leak or Restriction: Conversely, if the actual pressure is notably lower than expected, it could point to undercharging from a leak or a restriction in the refrigerant flow.
Advanced Diagnostics and Future Considerations
While the PT chart primarily focuses on the saturated state, superheat and subcooling offer deeper insights into the system’s refrigerant cycle efficiency. Delving into these concepts will strengthen your troubleshooting abilities. Ongoing refrigerant research may lead to data refinements and the development of environmentally friendlier alternatives to R410A.
Essential Tools and Safety Precautions
Using an R410A PT chart effectively requires a high-quality pressure gauge, a reliable thermometer, and, of course, the chart itself. However, always prioritize safety. Wear appropriate gear and ensure adequate ventilation when handling refrigerants. If unsure, consult a qualified HVAC technician.
What is the Suction and Discharge Pressure of R410A?
The suction (low-side) pressure is the “intake” pressure, drawing the relatively cool refrigerant back into the system. The discharge (high-side) pressure, significantly higher, is created by the compressor’s action, increasing the refrigerant’s pressure and temperature for heat release in the condenser. The interplay of pressure and temperature is pivotal, as they are directly related. Interested in a more detailed breakdown of how pressure and temperature readings indicate the specific issues? Our detailed R410A pressure guide will be a real help here.
The R410A PT Chart: Your Pressure Decoder
The R410A PT chart illustrates this pressure-temperature relationship. By measuring the refrigerant temperature, you can use the chart to determine the corresponding pressure, verifying system functionality and aiding in diagnostics.
Troubleshooting: Pressure Clues
Deviations from the expected pressure (as per the PT chart) signal potential issues. For example, low suction pressure could suggest a refrigerant undercharge (possibly a leak), high suction pressure might indicate an overcharge or system restriction, and high discharge pressure could point to an overcharge, dirty condenser coil, or other issues.
Superheat, Subcooling, and Beyond
Beyond basic pressure checks, superheat and subcooling offer a more refined understanding of system performance, revealing how effectively the refrigerant absorbs and releases heat. These additional measurements can provide valuable insights into your system’s health and efficiency. While R410A is currently widely used, research is continually exploring its behavior and environmental impact, as well as the development of newer, more ecologically friendly refrigerants. Always prioritize safety and consult with a qualified technician when necessary.
- Unveiling Bernhard Caesar Einstein’s Scientific Achievements: A Legacy in Engineering - July 15, 2025
- Uncover who is Jerry McSorley: CEO, Family Man, Business Success Story - July 15, 2025
- Discover Bernhard Caesar Einstein’s Scientific Contributions: Unveiling a Legacy Beyond Einstein - July 15, 2025



1 thought on “Understanding the R410A PT Chart: A Practical Guide for HVAC Professionals”
Comments are closed.