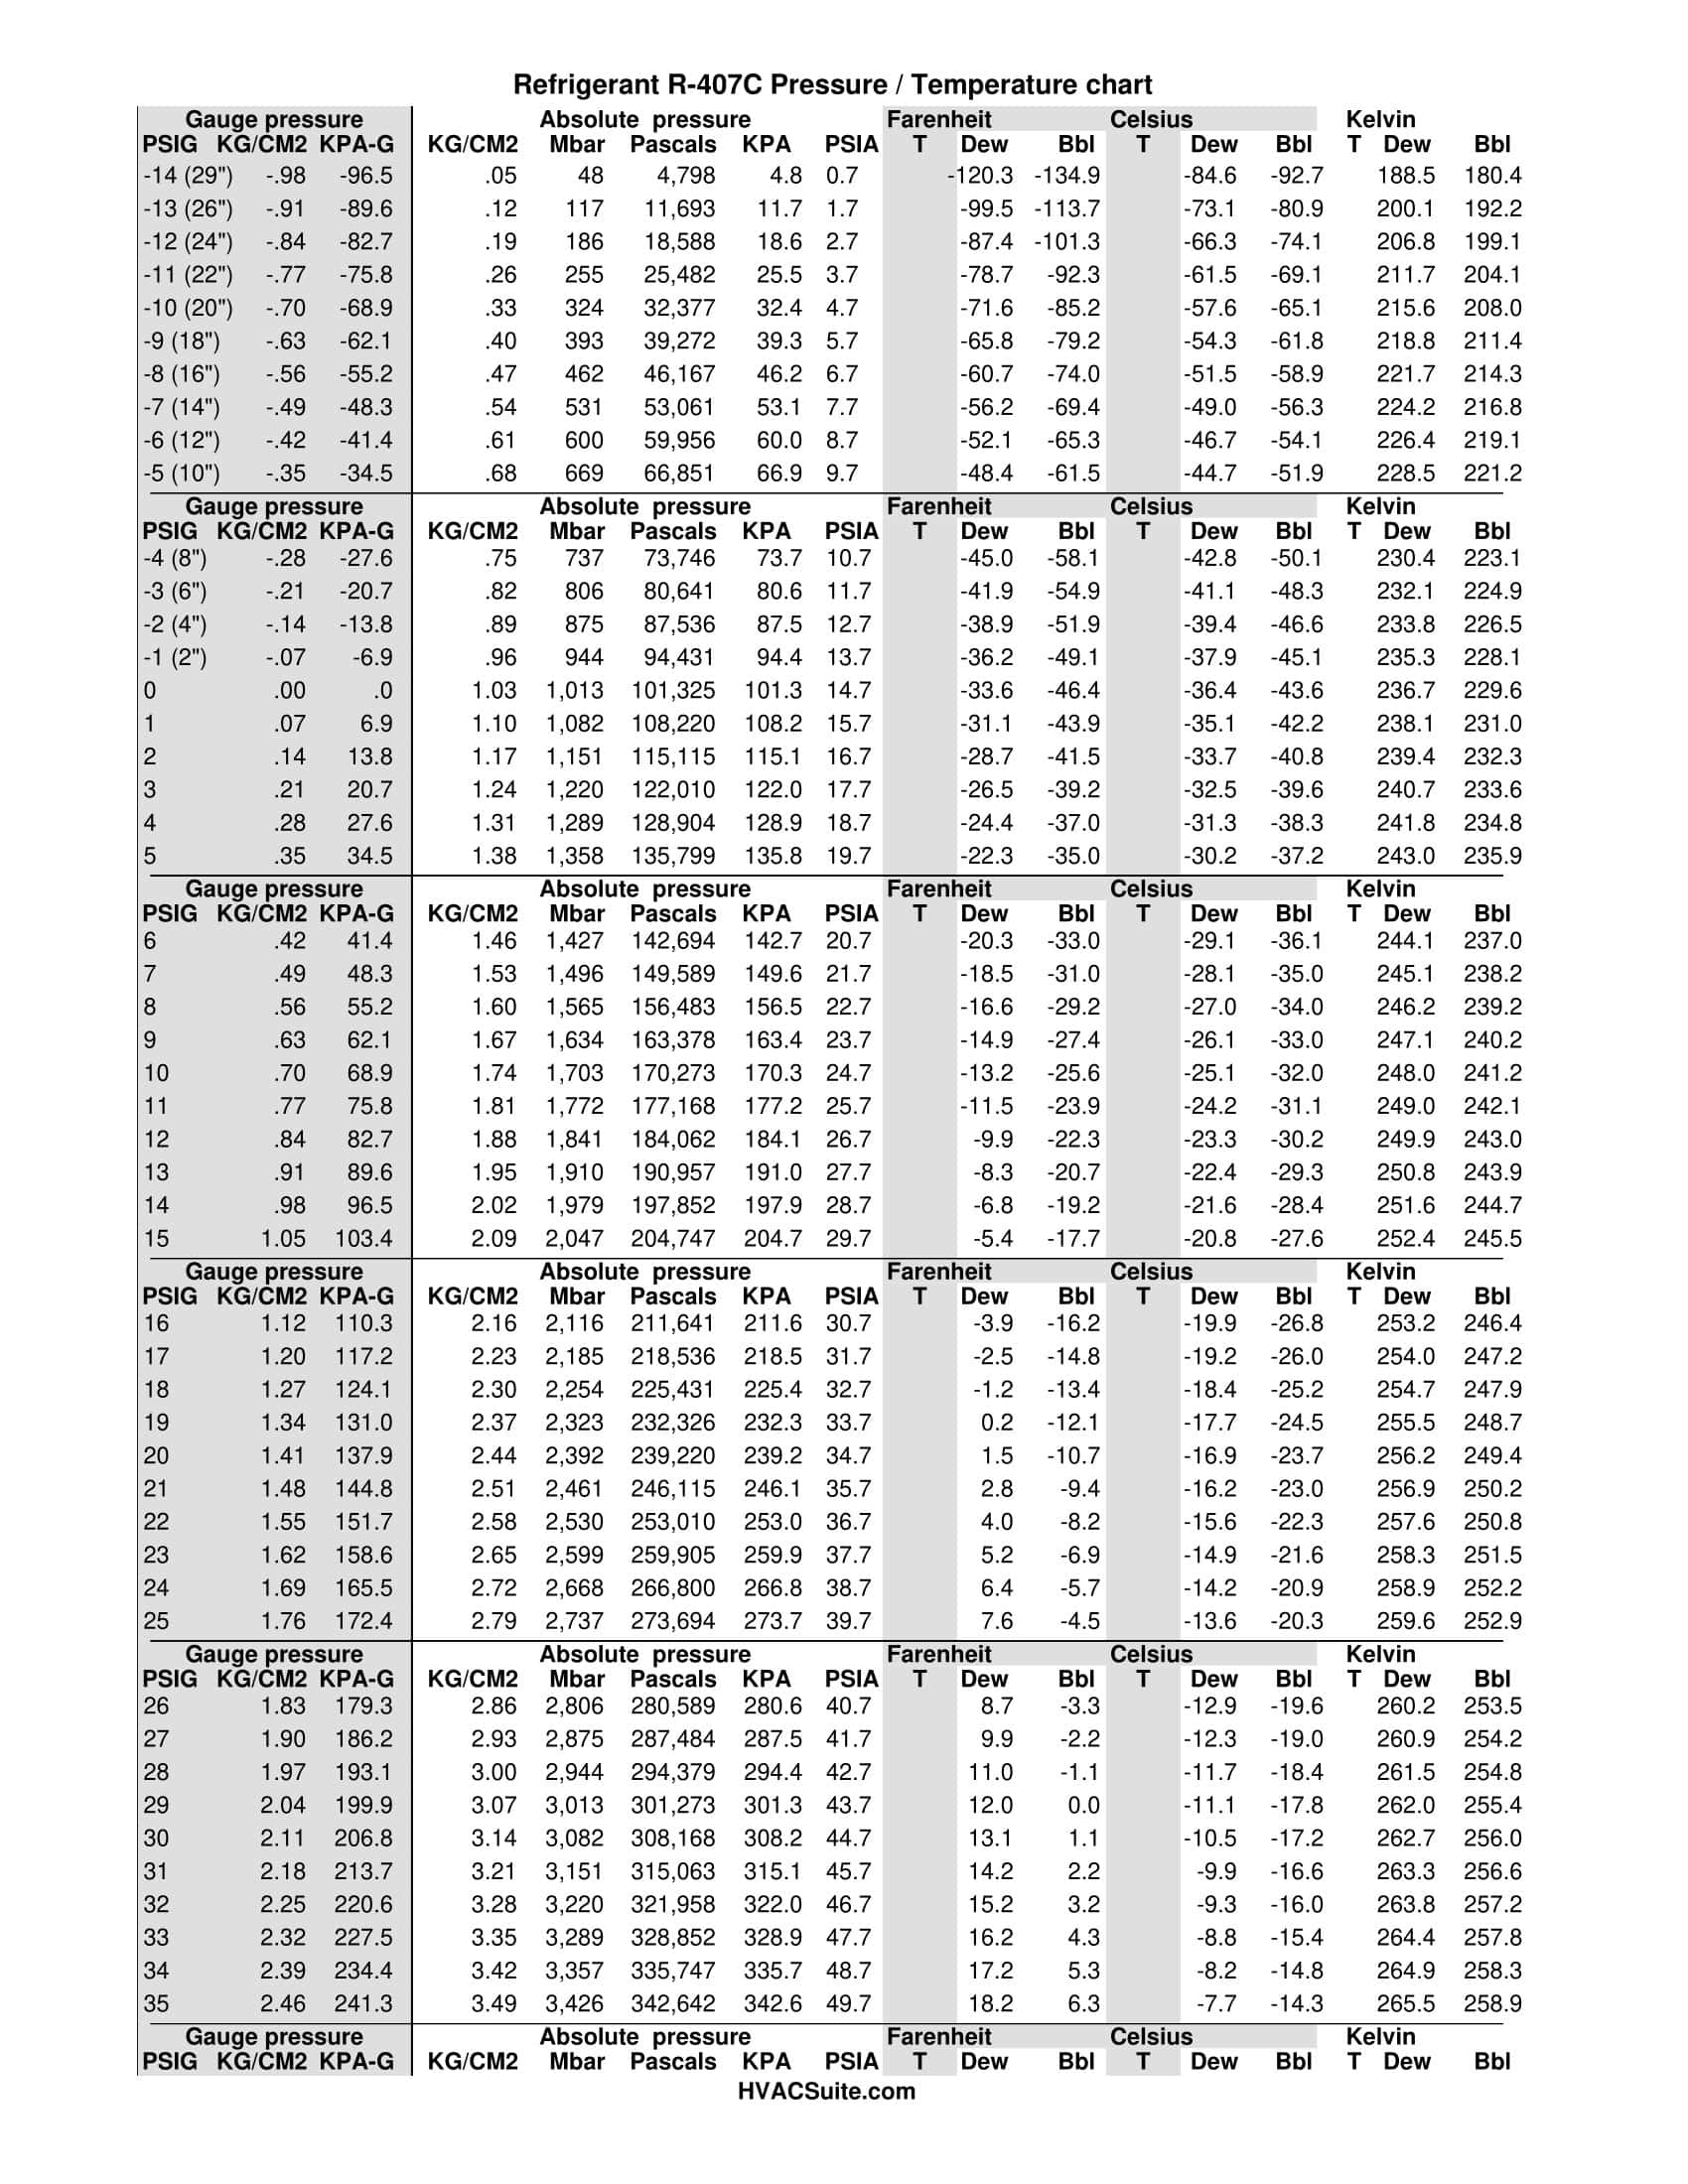
Dealing with R-407C? This guide explains how to use the pressure-temperature (PT) chart, a crucial tool for diagnosing system issues and ensuring correct charging. Whether you’re a seasoned technician or just starting out, this guide provides step-by-step instructions and downloadable resources. Download your R-407C PT Chart PDF here.
Decoding the R-407C PT Chart
Pressure-Temperature Relationship
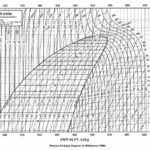
The PT chart visually represents the relationship between pressure and temperature for R-407C. It helps determine the refrigerant’s state (liquid, vapor, or a mix). Pressure is typically displayed on the vertical axis (psig or bar) and temperature on the horizontal axis (°F or °C). Saturation curves divide the chart into zones for liquid, vapor, and the mixed liquid-vapor state.
Using the Chart
To find the pressure at a specific temperature, locate the intersection of the temperature and pressure lines. Due to R-407C’s unique properties as a zeotropic blend (discussed below), interpreting the chart requires careful consideration of temperature glide.
R-407C: A Zeotropic Blend
R-407C is a blend of R-32, R-125, and R-134a. Its zeotropic nature means its temperature changes during phase changes (evaporation or condensation) even at constant pressure. This temperature shift, known as “temperature glide,” requires careful attention when using the PT chart to avoid misinterpretations.
Superheat and Subcooling
Superheat is the temperature difference between refrigerant vapor and the saturation temperature at a given pressure. Subcooling is the difference between refrigerant liquid and the saturation temperature. Accurate measurement of these values is crucial for system optimization and requires accounting for temperature glide.
Practical Applications
The PT chart is essential for:
- Charging a System: Determining the correct refrigerant amount.
- Diagnosing Leaks: Identifying potential leaks by comparing pressure and temperature readings with chart values.
- Evaluating Efficiency: Assessing system performance and identifying areas for improvement.
Troubleshooting
Here’s how the chart helps diagnose common issues:
| Problem | Possible Causes |
|---|---|
| Low Suction Pressure | Undercharge, Restricted Airflow, Faulty TXV |
| High Suction Pressure | Overcharge, Faulty Compressor, High Ambient Temperature |
| Low Discharge Pressure | Low Refrigerant Charge, Faulty Compressor |
| High Discharge Pressure | Overcharge, Faulty Condenser Fan, Restricted Airflow |
R-407C vs. R-22
R-407C is not a drop-in replacement for R-22. They have different operating pressures and require specific handling procedures.
Safety First
Always adhere to proper handling procedures, wear appropriate PPE, and consult SDS when working with refrigerants.
Understanding R-407C System Pressures
Why R-407C Pressures Aren’t Simple
R-407C’s blended nature means its pressure changes with temperature fluctuations due to temperature glide. The PT chart is essential for understanding these dynamic pressure changes.
Pressure’s Role in System Health
Maintaining correct pressure is critical for system efficiency. Low pressure could suggest a leak or compressor issues, while high pressure might indicate an overcharge or blockage.
Temperature Glide Explained
R-407C’s temperature fluctuates during phase changes, even at constant pressure, making the PT chart essential for interpreting system behavior.
Using the PT Chart: A Step-by-Step Guide
- Measure the refrigerant temperature. Consider using a thermocouple for accurate readings.
- Locate the temperature on the chart’s horizontal axis.
- Find the corresponding liquid and vapor pressures on the vertical axis.
- Compare these values to the actual system pressures. Discrepancies can indicate problems.
Troubleshooting Examples
- Low Suction Pressure: Could suggest a leak, restricted airflow, or a faulty expansion valve.
- High Suction Pressure: Could indicate an overcharge, air in the system, or excessive superheat.
R-407C and R-22: Not Interchangeable
R-407C and R-22 have different pressure-temperature characteristics and require specific PT charts.
Safety Precautions
Always wear appropriate PPE and follow safety procedures when handling refrigerants.
R-407C Operating Temperatures
The R-407C PT Chart: Decoding Temperature
R-407C’s operating temperature depends on the system pressure. The PT chart helps determine this relationship, showing that R-407C can work from -49°F to 150°F (-45°C to 65.6°C).
Why the PT Chart Matters
The PT chart helps diagnose system issues. Low pressure for a given temperature might suggest a leak or undercharge, while high pressure could indicate an overcharge or blockage.
Beyond Troubleshooting: Optimizing Performance
The PT chart enables technicians to calculate subcooling and superheat for optimizing system efficiency.
R-407C: Key Facts
- Composition: Blend of HFC refrigerants.
- Applications: Medium-temperature commercial and industrial refrigeration, A/C.
- Color Code: Burnt orange.
Real-World Scenarios
- Low pressure could indicate a leak.
- High pressure could suggest an overcharge.
R-407C and R-22 Pressures: A Comparison
Different Pressures, Different Requirements
R-407C and R-22 operate at different pressures. R-407C typically has lower discharge pressure but higher suction pressure, necessitating system adjustments during retrofits. This difference impacts compressor operation and overall system performance.
Understanding the 407C PT Chart
The 407C PT chart is essential for understanding the relationship between pressure and temperature, crucial for diagnostics and charging.
Why the Difference?
R-407C’s blend composition contributes to its unique pressure characteristics, distinguishing it from single-component refrigerants like R-22.
Using the 407C PT Chart
- Measure the temperature at the service valve.
- Locate the temperature on the chart’s horizontal axis.
- Trace upwards to find the corresponding pressure on the curved lines.
- Compare the chart pressure with the actual system pressure. Discrepancies suggest potential issues.
Temperature Glide
R-407C’s temperature changes during phase transitions, requiring consideration of both liquid and vapor pressures on the PT chart.
Oil Compatibility
R-407C uses POE oil, while R-22 typically uses mineral oil. These oils are not compatible. Flushing the system during a retrofit is essential. A polyurea garage floor coating offers excellent chemical resistance and may be beneficial in areas where refrigerant spills are a concern.
Conclusion
The 407C PT chart is an invaluable tool. Understanding pressure differences between R-407C and R-22, along with temperature glide and oil compatibility, is crucial for efficient and reliable system performance.
- Unveiling Bernhard Caesar Einstein’s Scientific Achievements: A Legacy in Engineering - July 15, 2025
- Uncover who is Jerry McSorley: CEO, Family Man, Business Success Story - July 15, 2025
- Discover Bernhard Caesar Einstein’s Scientific Contributions: Unveiling a Legacy Beyond Einstein - July 15, 2025


2 thoughts on “Understanding the R407C PT Chart: A Practical Guide for HVAC/R Professionals (with Downloadable PDF)”
Comments are closed.