Struggling with inverse normal distribution problems? Need to quickly find z-scores or percentiles? This guide provides a clear, step-by-step approach to understanding and using the invNorm calculator, regardless of your statistical background. Whether you’re tackling statistics coursework or analyzing data professionally, we’ll show you exactly how this tool works and how it can significantly improve your data analysis skills. We’ll cover practical examples, compare different calculators, and address common troubleshooting issues. Let’s unlock the power of the invNorm calculator together!
Mastering the InvNorm: From Basics to Real-World Applications
The invNorm calculator is an invaluable tool for solving problems related to the normal distribution. It helps find the value (z-score or raw score) corresponding to a given cumulative probability (area under the curve). Let’s explore!
Understanding Inverse Normal Distribution
The normal distribution, often visualized as a bell curve, shows the probability distribution of a continuous random variable. The invNorm function essentially reverses this process. Instead of inputting a raw score or z-score to get a probability, we input a probability and it outputs the corresponding score. This is useful in many statistical analyses, such as determining confidence intervals and critical values in hypothesis testing.
Using the InvNorm Calculator: A Step-by-Step Guide
Most invNorm calculators require three inputs:
1. Probability (p): This represents the cumulative probability or area under the curve to the left of the desired value. It’s always a decimal between 0 and 1. For instance, to find the value separating the top 10%, your probability would be 0.9 (since 90% is below that top 10%).
2. Mean (μ): This is the average of your data set, representing the center of your bell curve.
3. Standard Deviation (σ): This measures the spread of your data. A larger standard deviation results in a wider, flatter curve, while a smaller one creates a taller, narrower curve.
After entering these values, the calculator outputs the corresponding z-score (for a standard normal distribution, mean=0, standard deviation=1) or the raw score (for other distributions).
Example: Putting it All Together
Suppose exam scores have a mean (μ) of 75 and a standard deviation (σ) of 10. We want to find the score separating the top 10% of students. Our probability (p) is therefore 0.9. Inputting (0.9, 75, 10) into an invNorm calculator might yield a result of approximately 88. This means a score of 88 or higher separates the top 10% from the rest.
Deep Dive: Mean, Standard Deviation, and Probability
Accurate results hinge on correctly understanding these crucial inputs:
- Probability (p): Always expressed as a decimal between 0 and 1, representing the area under the curve to the left of the desired value.
- Mean (μ): The average value of the dataset. Altering the mean shifts the entire bell curve left or right.
- Standard Deviation (σ): Controls the curve’s width. A larger standard deviation produces a wider, flatter curve, whereas a smaller one yields a taller, narrower curve.
Broad Applications: Where InvNorm Shines
InvNorm’s usefulness extends beyond academic statistics. It’s crucial in various fields:
- Finance: Risk assessment, investment decisions, portfolio management.
- Healthcare: Analyzing health data, predicting patient outcomes, and understanding disease progression.
- Engineering: Quality control, optimizing manufacturing processes to ensure specifications are met.
- Many more: Any situation involving normally distributed data where a specific value corresponding to a probability is needed.
Interpreting Results and Troubleshooting
The calculator typically returns a z-score (for standard normal distributions) or an x-value (the actual value in your dataset). A z-score indicates how many standard deviations a given value is from the mean.
The most common error is entering an incorrect probability. Always double-check your input before initiating the calculation.
Comparing InvNorm Calculators
Numerous online and calculator-based invNorm tools exist, each with unique features. The optimal choice depends on individual needs.
| Calculator Name | Pros | Cons |
|---|---|---|
| Calculator A | User-friendly interface | Limited features |
| Calculator B | Advanced options, handles various distributions | Steeper learning curve |
| Calculator C | Integrated into comprehensive statistics software | May be overkill for simple invNorm calculations |
Remember, mastering the invNorm calculator empowers you to delve deeper into statistical analysis. It’s a valuable asset for anyone working with normally distributed data.
How to Perform invNorm on a Calculator
Let’s delve into the practical application of invNorm on various calculators. It’s the reverse of finding the area under a normal distribution curve. It allows you to find a value (z-score or a raw score) when the cumulative probability is known.
To use invNorm, three key pieces of information are needed:
- Probability (Area): The area under the curve to the left of the value you wish to find. A value between 0 and 1.
- Mean (µ): The average of your dataset.
- Standard Deviation (σ): A measure of data dispersion.
The output is either a z-score (for standard normal distributions) or a raw score (for other distributions), indicating the position of that probability on the curve.
Calculator-Specific Instructions
Let’s explore the practical implementation of invNorm across different calculators:
TI-84 (and similar TI-83)
- Press [2nd], then [VARS] (to access the DISTR menu).
- Select
invNorm(. - Enter probability, mean, and standard deviation (separated by commas). E.g.,
invNorm(.95,0,1)for a standard normal distribution with a probability of 0.95. - Press [ENTER].
TI-30X Plus MathPrint
The TI-30X Plus MathPrint may not have a dedicated invNorm function, but it likely provides an equivalent function (inverse cumulative normal distribution) within its stats menus. Consult your calculator’s manual for exact steps.
Online Calculators: A Convenient Alternative
Numerous free online invNorm calculators are available. A simple online search reveals several options, offering user-friendly interfaces and instant results.
Real-World Applications
Let’s illustrate invNorm’s practical use:
Imagine you’re a packaging engineer needing to ensure that at least 98% of packaged products meet a specific weight. Using invNorm, based on the products’ mean and standard deviation, you can calculate the minimum acceptable weight, informing quality control standards.
Calculator Comparison
| Calculator | InvNorm Function? | Input Requirements | Output |
|---|---|---|---|
| TI-84 (TI-83) | Yes | Probability, Mean, Standard Deviation | z-score or raw score |
| TI-30X Plus | (Inverse CDF) | Probability, Mean, Standard Deviation | z-score or raw score (via inverse CDF) |
| Online Calculators | Yes | Probability, Mean, Standard Deviation | z-score or raw score |
Troubleshooting Common Issues
- Probability Error: Ensure your probability is between 0 and 1.
- Unit Consistency: Use consistent units for mean and standard deviation.
- Calculator Mode: Confirm your calculator is in the correct statistical mode.
Key Takeaways
- InvNorm calculates the value corresponding to a specified probability in a normal distribution.
- It requires probability, mean, and standard deviation as input.
- The output is a z-score (for standard normal distributions) or a raw score (otherwise).
- InvNorm has broad applications in many fields.
Understanding the InvNorm Formula
While there isn’t a single, simple algebraic formula for invNorm, we can explore the underlying principles. It’s more of a process than a single equation.
Decoding Inverse Normal Distribution
InvNorm helps you find the value (x or z-score) associated with a specific cumulative probability in a normal distribution. It essentially reverses the process of finding the area under the curve.
Key Parameters
InvNorm requires three inputs:
- Probability (p): Cumulative probability (area to the left) between 0 and 1.
- Mean (μ): The average of the data.
- Standard Deviation (σ): Measure of data dispersion.
Calculation Process
For a standard normal distribution (mean=0, standard deviation=1), a Z-table or statistical software can be directly employed. For non-standard distributions:
- Standardize: Convert data to a standard normal distribution using
Z = (x - μ) / σ. - Look it up: Use a Z-table or software to find the Z-score matching
p. - Unstandardize: Convert back to the original x-value:
x = μ + Zσ.
Utilizing Software and Calculators
Software like R, Python (SciPy), and Excel simplify calculations. Graphing calculators provide built-in functions.
| Software/Calculator | Function/Command | Notes |
|---|---|---|
| R | qnorm(p, mean = μ, sd = σ) | Powerful statistical programming language. |
| Python (SciPy) | scipy.stats.norm.ppf(p, loc=μ, scale=σ) | Part of SciPy, for scientific computing. |
| Excel | NORM.S.INV(p) (standard), NORM.INV(p, μ, σ) (non-standard) | Built-in functions in Microsoft Excel. |
| TI-84 Calculator | invNorm(p, μ, σ) | Common graphing calculator. |
Real-World Example
With an average (μ) of 70 and standard deviation (σ) of 10, let’s find the x-value for a cumulative probability (p) of 0.90. A calculator yields a Z-score of approximately 1.28. Applying x = μ + Zσ, we get x = 70 + 1.28 * 10 = 82.8. Thus, 82.8 represents the value corresponding to the top 90% of the data.
InvNorm Applications
InvNorm is applicable in various fields:
- Quality Control
- Finance
- Healthcare
- Research
Key Takeaways:
- InvNorm isn’t a single equation but a process of finding a value linked to a given probability in a normal distribution.
- Parameters like probability, mean, and standard deviation are needed.
- Statistical software and calculators are crucial for efficient computations.
- InvNorm has wide-ranging applications across multiple disciplines.
Normalcdf vs. InvNorm: Choosing the Right Tool
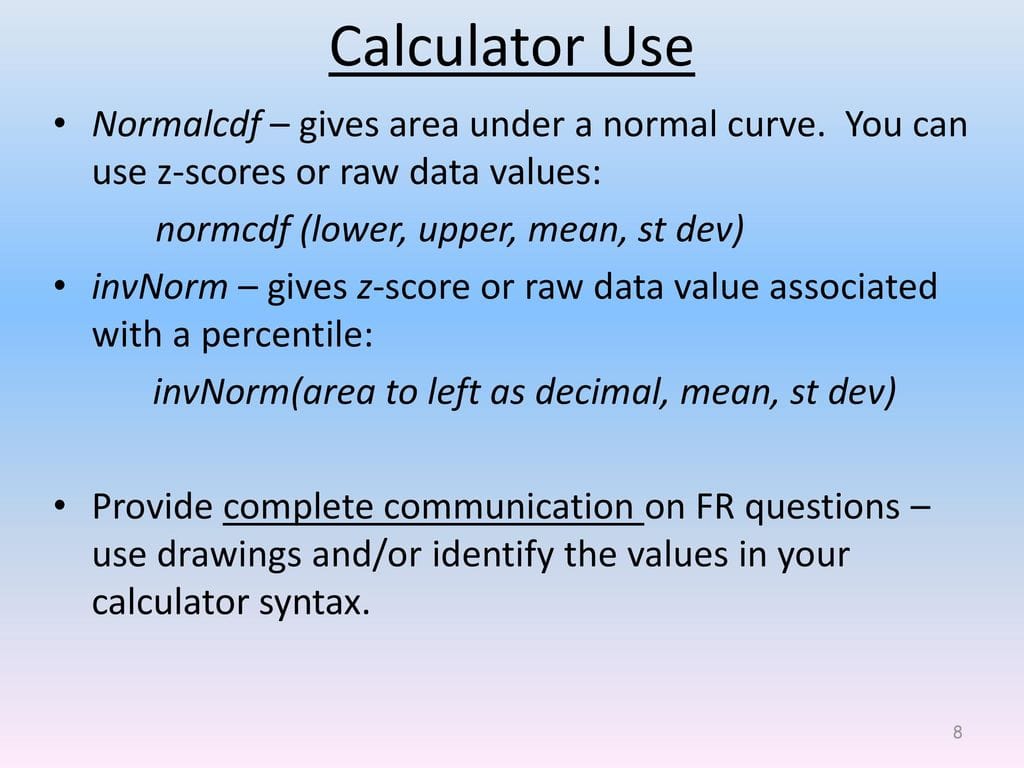
Let’s clarify the distinction between normalcdf and invNorm. normalcdf helps find the probability of a value falling within a specific range, whereas invNorm helps find the value corresponding to a specific probability. The choice depends entirely on the information available and the goal of your analysis.
Normalcdf: Probability from a Range
Normalcdf (normal cumulative distribution function) calculates the probability of a value falling within a given range. You input the lower and upper bounds of the interval, mean, and standard deviation. The output is the probability of a value falling within that range (as a decimal).
Example: What’s the probability of a student getting a score between 80 and 90 on a test (mean=75, standard deviation=10)? normalcdf gives you the answer.
InvNorm: Value from a Probability
InvNorm (inverse normal cumulative distribution function) calculates the value associated with a given probability. You input the probability, mean, and standard deviation. The output is the value (x-value or z-score) corresponding to that probability.
Example: What score separates the top 5% of students? InvNorm will help you find it.
Calculator Instructions (TI-83/84 and similar)
- Access DISTR Menu: Press [2nd] then [VARS].
- Select Function: Choose
normalcdf(for probabilities orinvNorm(for values. - Enter Parameters: Input values as needed (see tables below).
- Interpret Results:
normalcdfreturns a probability;invNormreturns a value.
Normalcdf vs. InvNorm: A Summary
| Feature | Normalcdf | InvNorm |
|---|---|---|
| Input | Range, mean, standard deviation | Probability, mean, standard deviation |
| Output | Probability (0-1) | Value (x or z-score) |
| Use Case | Find probability for a given range of values | Find value associated with given probability |
Remember to carefully consider which function is appropriate for your data and analysis goals. Practice with both functions will reinforce your understanding.
- China II Review: Delicious Food & Speedy Service - April 17, 2025
- Understand Virginia’s Flag: History & Debate - April 17, 2025
- Explore Long Island’s Map: Unique Regions & Insights - April 17, 2025


