Ever wondered how much of your data actually clusters around the average? Chebyshev’s Theorem offers a surprisingly simple way to get a handle on this, regardless of how strangely your data might be distributed. Even better, a Chebyshev’s Theorem Calculator can do the heavy lifting for you!
Understanding Chebyshev’s Theorem
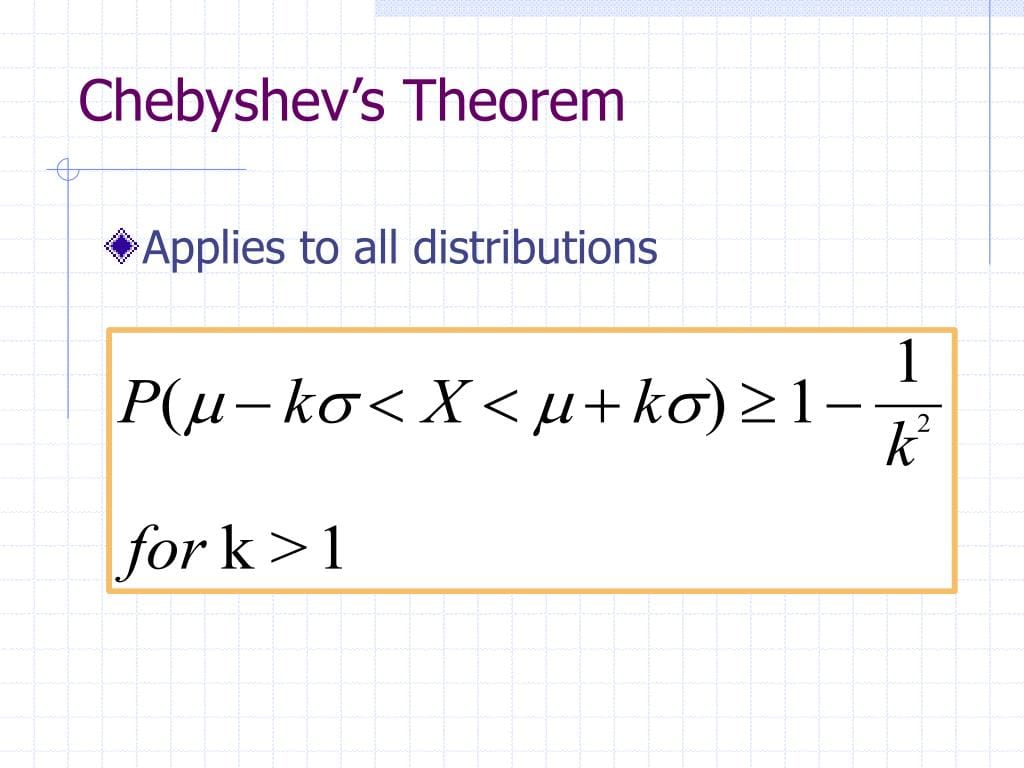
Imagine your data spread out like a messy pile of toys. The mean is like the center of the pile. Chebyshev’s Theorem tells us that no matter how scattered those toys are, a certain percentage will always be within a specific distance from the center. More formally, it states that for any dataset, at least 1 – (1/k²) % of the data will fall within k standard deviations of the mean. Think of ‘k’ as the size of the circle you draw around the center of your toy pile. Standard deviation, on the other hand, tells you how spread out the toys are in general. This theorem provides a universal method to estimate data distribution (regardless of its shape) and calculates the probability of a data point being more than k standard deviations away from the mean.
Using the Chebyshev’s Theorem Calculator
Using the Chebyshev’s Theorem Calculator is a snap. You just need three pieces of information:
Mean (μ): This is simply the average of your data.
Standard Deviation (σ): This measures how spread out your data is from the mean.
k: This is the number of standard deviations away from the mean you’re interested in.
Example: Test Scores
Let’s say you’re looking at test scores, and the mean score is 80 with a standard deviation of 10. You want to know what percentage of students scored within 2 standard deviations of the mean (k=2).
- Input: Enter 80 for the mean, 10 for the standard deviation, and 2 for k.
- Result: The calculator will likely tell you 75%. This means you can reasonably expect at least 75% of the students scored between 60 and 100 (80 ± 2*10). Remember, Chebyshev’s theorem guarantees that at least 75% of data falls within 2 standard deviations of the mean, and the 75% Chebyshev interval is calculated as [μ – 2σ, μ + 2σ].
Why Use a Chebyshev’s Theorem Calculator?
- Universal Applicability: Works for any data distribution.
- Conservative Estimation: Provides a minimum percentage. It offers conservative estimates, ensuring a minimum proportion of data within a specified range from the mean.
- Speed and Simplicity: Eliminates manual calculations.
Applications of Chebyshev’s Theorem
This theorem comes in handy in various fields:
- Data Analysis: Understand data spread and identify potential outliers.
- Quality Control: Assess product adherence to tolerance limits.
- Risk Assessment: Estimate probability of investment returns within a certain range.
- Healthcare: Analyze distribution of patient responses to medication. It’s used in healthcare to analyze patient data and medication effectiveness.
Discover the celestial wonders of constellations the plough and immerse yourself in the enigmatic world of chronicles of the nephilim.
Calculating Chebyshev’s Theorem
The Formula
The core of Chebyshev’s theorem lies in its formula:
1 - (1/k²)
Where ‘k’ is the number of standard deviations away from the mean. Chebyshev’s theorem estimates the minimum proportion of data within a specified range of standard deviations from the mean using this formula.
Example: Sunflower Heights
Imagine you’re looking at the heights of sunflowers. The average height is 6 feet, and the standard deviation is 1 foot. You want to know the percentage of sunflowers within 2 standard deviations (k=2).
- Plug into the formula: 1 – (1/2²) = 0.75 or 75%.
This suggests that at least 75% of the sunflowers will likely be between 4 and 8 feet tall. To calculate Chebyshev’s value in Excel, after entering relevant data, use the formula =1-(1/C1^2), where C1 contains your ‘k’ value. The result is the percentage of data falling within the chosen range of standard deviations.
Table of Common ‘k’ Values
| k (Standard Deviations) | Minimum Percentage Within k Standard Deviations |
|---|---|
| 2 | 75% |
| 3 | 88.9% |
| 4 | 93.8% |
Calculating Chebyshev’s in Excel
Excel simplifies the calculations.
Gather Data: Calculate your mean and standard deviation. Use
AVERAGE()andSTDEV().Determine ‘k’: Define how many standard deviations from the mean you want to consider.
The Excel Formula:
=1-(1/k^2). Replace ‘k’ with your chosen value or the cell containing it.Interpreting Results: The result is the minimum percentage of data within the specified range.
Important Considerations and Ongoing Research
Chebyshev’s theorem works for any data distribution, a key advantage. However, its estimates can be conservative. Researchers are exploring ways to refine statistical tools, and some experts believe there may be further refinements to our understanding of the theorem in the future. While the core principles remain robust, ongoing studies might reveal more nuances. It’s important to remember that Chebyshev’s theorem provides a conservative estimate, meaning the actual proportion of data within the range may be higher. One limitation is that it provides conservative estimates, with the possibility of higher proportions in actual data.
Limitations and Comparisons
Chebyshev’s Theorem, while powerful, has limitations. It provides a lower bound, meaning the actual percentage of data within the calculated interval might be higher. This is particularly true if your data follows a normal distribution. For normal distributions, methods like the Empirical Rule (68-95-99.7 rule) provide more precise estimates. However, Chebyshev’s Theorem shines when you don’t know the shape of your data distribution, as it applies to any distribution.
By understanding Chebyshev’s Theorem and using a calculator, you gain a quick way to extract insights from any data. So give it a try and see what you discover!
- Unlock Elemental 2 Secrets: Actionable Insights Now - April 2, 2025
- Lot’s Wife’s Name: Unveiling the Mystery of Sodom’s Fall - April 2, 2025
- Photocell Sensors: A Complete Guide for Selection and Implementation - April 2, 2025


